[wp_tech_share]

We recently updated the 2020 Telecom Capex Report. In this report, we analyze the relationships between wireless and wireline capex and revenue for more than 50 carriers, accounting for approximately 80% of worldwide capex and revenue. Given that the correlation between the equipment programs and telecom capital intensities remain significant, we believe there is value to study these trends. Some of the highlights from the report are shown below. For more info or if you need full access to the report, please contact dgsales@delloro.com.

  • Following three years of declining capex trends between 2015 and 2017 and flat trends in 2018, preliminary readings suggest that worldwide telecom capex—the sum of wireless and wireline telecom investments—increased 0% year-over-year (Y/Y) in nominal U.S Dollar (USD) and 2% in constant currency conditions.
  • Delloro-2020 Worldwide telecom capexThe growth in capex was driven by stable demand for wireline capex and surging investments in wireless related technologies to accommodate the on-going shift from 4G to 5G. Wireless capex increased 1% Y/Y in nominal USD terms while currency adjusted wireless capex advanced 4% Y/Y. Initial estimates indicate currency adjusted wireline capex was flat in 2019.
  • The bulk of the capex growth can be attributed to increasing investments in the Asia Pacific (APAC) region, driven primarily by improving trends in China and surging capex growth South Korea. The data for the operators we track indicate 2019 capex advanced at a low-single digit rate Y/Y in the APAC region. At the same time, capex in nominal USD terms declined at a low-single digit rate in both North America and Europe.
  • Preliminary vendor report estimates suggest that the combined revenues of the carrier-related equipment programs tracked by the Dell’Oro Group (Broadband Access, Microwave Transport, Mobile Core Network, Mobile RAN, Optical Transport, and Routers & CE Switches) increased approximately 2% in 2019, suggesting that the relationship between carrier capex and supplier infrastructure equipment revenues remained strong.
  • Even as we are issuing this forecast in the middle of a pandemic, we have not made any material downward revisions, partly because we believe this recession is a bit different than previous recessions. While there are clearly some downside risks over the short-term, we also believe there could be some long-term positives. Global capex growth for the 2019-2022 period is projected to improve at a CAGR of 1% in nominal USD terms. We continue to forecast robust wireless capex growth for 2020, reflecting positive demand in the Asia Pacific region with wireless capex in China expected to advance 15% to 20%.
  • Delloro-2020 Worldwide captial intensityPreliminary guidance suggests 5G will drive more than 80% of the mobile network related capex in 2020 in China, underpinning projections that the operators will continue to rollout 5G at a torrid pace with the collective 5G BTS macro installed base eclipsing half a million by 2020.
  • Even with AT&T’s expected capex pull-back in 2020, we project capex levels in the U.S. to remain stable over the forecast period—total U.S. capex (excluding T-Mobile/Sprint integration capex) is projected to remain elevated over the forecast period. The projected capex envelope for the U.S. telecom market assumes investments in mid-band capex will remain elevated, millimeter wave investments will increase, and low-band related capex will remain flat or decline.
  • Global risks are broadly balanced. On the one hand, the fundamentals remain healthy with the on-going shift from 4G to 5G, healthy end user fundamentals, and the increased realization that broadband is an essential utility. Even so, we are issuing this forecast in the middle of a pandemic, and it is still early days to fully grasp the human and economic impact from COVID-19. So at this juncture, we envision there could be some albeit limited short-term capex downside due to the COVID-19. At the same time, there are still some practical short-term challenges as countries shut down for a couple of months impacting the supply chain and the ability to perform network upgrades and deploy new equipment. Medium to long-term, we envision COVID-19 could have a positive impact on capex. We are not downplaying the tragedy that the Coronavirus represents with immeasurable humans losses and massive economic losses. But we do believe COVID-19 has and will continue to expose the digital divide accelerating the need for businesses and governments to review their broadband plans to not only prepare for the next pandemic, but also to accelerate their digital transformation plans.
[wp_tech_share]

With virtual MWC coming to an end, we are sharing some of the RAN related highlights below. To access the entire summary, please contact Daisy@delloro.com.

COVID-19 – It is no longer just about the supply chain

When we updated the 2020 outlook in conjunction with the 4Q19 RAN report, we assessed the potential supply chain risks as a result of COVID-19. At the time, the suppliers were not overly concerned about their abilities to meet 2020 shipments. While this assessment still holds, the overall situation has evolved since we published the report. In addition to any potential supply chain risks, other variables to consider include:

  1. The broader impact on the markets, the economy, and the increased risk of a recession – significant changes in GDP output could impact capex.
  2. Impact on cellular data traffic as people cut down on commuting and social events and spend more time at home.
  3. The suppliers might figure out how to minimize supply chain risks, but even with differing revenue recognition practices, sooner or later someone needs to deploy the equipment in the appropriate location.
  4. Forex exchange movements could affect the RAN market in U.S. Dollar (USD) terms if tightening financial conditions and aggressive stimulus by the Federal Reserve will move the USD relative to the Euro, SEK, and the Yuan.
  5. Governments will likely try various stimulus packages. Tax incentives to spur capex growth could be on the table.
Massive MIMO – Strong focus on performance, bandwidth, weight, and power consumption

The Massive MIMO business case has changed rather significantly over the past two to three years with the technology now considered to be a foundational building block for mid-band NR deployments. And with Massive MIMO configured 5G NR systems accelerating at a much faster pace than expected in 2019 and the overall installed base now in the millions, it was not perhaps a major surprise that the technology for a second year in a row remained one of the leading RAN related MWC topics (MWC 2019 Massive MIMO blog, see link).

But what was interesting this year was the different focus among some of the leading suppliers with Huawei and ZTE focusing more on their respective bandwidth advantages while Ericsson and Nokia emphasized the performance benefits with their Massive MIMO systems.

Dynamic Spectrum Sharing (DSS) to play a pivotal role in 2020

DSS was a hot topic during vMWC, validating the message we have communicated for some time, namely that the technology will play a pivotal role in upgrading existing low-band LTE sites to NR in the second half of 2020—Verizon recently confirmed it will launch DSS nationwide in 2020. The timing for any operator that is considering DSS will in addition to device availability to some degree depend on their overall 5G strategy – is DSS a 5G logo, an improved experience, or a stepping stone towards something bigger.

As the operators are doing their best to differentiate their overall 5G strategies, some confusion is inevitable. And with T-Mobile publicly suggesting that DSS is not ready for prime time and the technology its current state would impact the overall capacity negatively, the leading vendors took some time to clarify the state and benefits with DSS. But the key point here is that there are only three ways to move from 4G to 5G with existing LTE spectrum (re-farming, static sharing, and DSS). And if we are going to discuss relative performance of DSS, Ericsson rightly pointed out that we need to compare apples-to-apples.

5G is more power efficient than LTE with comparable cell consumption

LTE and 5GNR Power ConsumptionWith operators ramping up 5G while still maintaining their legacy 2G-4G networks, the power consumption KPI appears to be moving up the priority list as operators are trying to ensure total 2G-5G cell site power consumption remains within reasonable power budgets.

Since there is no shortage of media coverage suggesting 5G cell sites will be significantly more power hungry than 4G cell sites, the vendors have over the past year ramped up the engineering and marketing efforts with their 5G portfolios.

Huawei has on numerous occasions discussed the 25x to 50x (future 100x) power consumption per bit advantage between 5G NR and LTE while acknowledging that the overall NR cell consumption could be slightly higher. And now, partly due to continued channel, carrier, and symbol shutdown advancements, Huawei announced that the total power budget between NR and LTE is comparable when comparing the 64TxRx AAU with the 4×60 W LTE RRU.

Virtual and Open RAN gain momentum

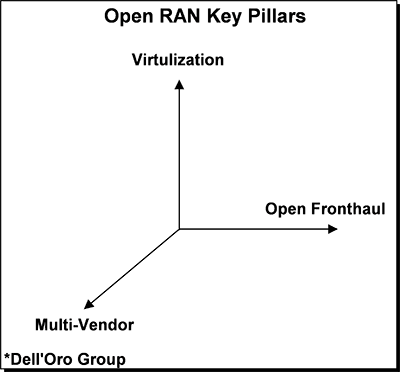
There are multiple ongoing RAN virtualization efforts driven both by operators and suppliers with the primary objective of realizing a more flexible architecture with uniform hardware platforms that will optimize TCO and service differentiation for both the known and unknown use cases.

Given the current progress and the overall readiness with both the Open RAN and Non Open RAN virtualization tracks, we anticipate that the benefits with purpose built RAN will continue to outweigh the benefits with Virtual RAN over the near-term.

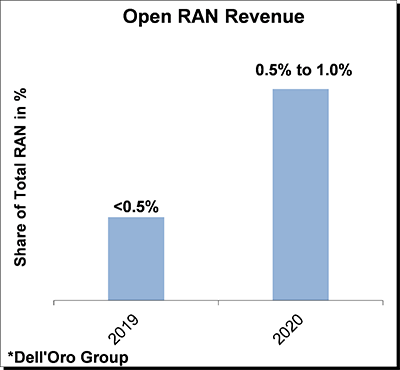
At the same time, the Open RAN momentum is moving in the right direction as the ecosystem develops, partnerships are forming, suppliers are ramping up investments, and operators are committing and experimenting with trials.

TIP announced a project targeting commercial multi-band radios by 2021 in the $1 K range. Even if the RAN is a relatively small portion of the overall site TCO, this cost structure is clearly compelling and would go a long way offsetting higher baseband compute costs typically associated with general purpose solutions.

For more details about the shift towards virtualized and Open RAN, please see separate blog.

For full blog access, please contact daisy@delloro.com.

[wp_tech_share]

Optical bandwidth is not limitless. I know we have all used the argument over the past few decades that by placing an optical fiber connection between two points you will have unlimited capacity. It is an argument we have all used when convincing the market that a fiber deployment future proofs the investment. Now, a few decades later, the reality of Shannon’s Limit hangs over service providers’ future like a dark cloud (an actual one, not the data center cloud kind).

Globally, service providers have always enjoyed the benefit of meeting customer requirements for higher network capacity at a lower per bit price by installing the latest optical DWDM transponders. It has been a tried-and-true method that leveraged the sunk costs related to fiber and amplifiers, often referred to as the fiber plant. Therefore, not only did a service provider benefit from the higher capacity and lower cost-per-bit inherent in each new generation of DWDM transponders, but they also benefited from installing these additional wavelengths in pre-existing fiber plants where much of the costs are either fixed (in the case of a leased fiber), depreciated (in the case of fiber ownership), or non-existent (in the case of fully depreciated fiber plants). The advantage of this is that for every bit added to a fiber, the cost of transporting the bits declines.

Even in the case of a green field deployment, the more a service provider can maximize the capacity of the fiber plant, the lower the cost of each bit transported. For example, if a fiber plant cost $4 million, the first gigabit may cost $4 million, but when 9,600 Gbps is installed, the cost-per-gigabit drops to $417 (Figure 1). It is a linear decline in cost. That is… until the capacity on a fiber can no longer increase due to Shannon’s Limit and spectrum availability.

Cost-per-Gigabit for $4 Million Fiber Plant
This constraint, brought about by the physical limitations of glass and light, brings to the forefront two challenges—extending the span length of higher wavelength speeds and increasing fiber capacity—and, fortunately for the industry, two solutions that will help service providers continue to reduce their cost-per-bit for at least another decade.

  1. 800 Gbps-capable transponders with probabilistic constellation shaping operating at around 96 Gbaud solves one of the challenges—extending the span length. Using these new transponders will help in a couple ways. For metro spans, service providers will immediately benefit from having a lower cost-per-bit by deploying one set of 800 Gbps line cards rather than two sets of 400 Gbps line cards. The second benefit is the extended reach. What was not shown in Figure 1 was that the un-regenerated span length of each wavelength speed diminishes as the wavelength speed goes up. However, with 800 Gbps-capable line cards, a 400 Gbps wavelength will be usable in many more fiber routes that extend in to the thousands of kilometers, reducing the need for costly regeneration sites. As a result, in both metro and long haul routes, 800 Gbps-capable line cards will reduce a service providers’ cost-per-bit.
  2. Expanding the usable spectrum in a fiber will solve the second challenge—increasing fiber capacity. For the longest time, optical equipment was designed to operate in 4 THz (80 channels @ 50 GHz) of fiber spectrum located in the C-band (Figure 2). Over time, equipment manufacturers increased it to 4.8 THz (96 channels @ 50 GHz). The next generation of equipment will inevitably be designed to operate in 6.0 THz (120 channels @ 50 GHz) of spectrum, referred to as Super C-band by Huawei. This action alone increases the amount of bandwidth-per-fiber by 25 percent. As a result, a fiber that had a maximum capacity of 38.4 Tbps (at 400 Gbps per wavelength) can now support 48.0 Tbps. Using our $4 million example in Figure 1, the cost-per-gigabit will be further reduced from $104 to $78.

Huawei Spectrum in C-Band

We believe these new technologies will need to be adopted in the future to continue the cost-per-gigabit declines that the market has gotten accustomed to.

Dell'Oro DWDM Long Haul Cost per GigabitAs a point of reference, in the past decade, the average annual decline in cost-per-gigabit for DWDM Long Haul transport equipment was about 20 percent due to improving spectral efficiency gains brought on by deployment of newer, higher-speed wavelengths (Figure 3). It was a similar rate of decline for WDM Metro, as well.

It probably does not need to be said, but this decline in the cost of a gigabit was a critical element needed for service providers to profitably keep up with network demand, which grew at an average annual rate of approximately 35 percent. Also, as we see it, demand for bandwidth will only grow from here, placing additional strain on service providers to profitably increase their network capacity for many more years.

We believe that with the new technologies mentioned, this pace of declining costs can continue to benefit service providers for at least another decade.

In the face of Shannon’s Limit, installing systems that can extract higher value from installed fiber becomes critical. Two technologies entering the market will push out the concerns brought by Shannon’s Limit for at least another decade. Therefore, to all the service providers, take a moment, and breathe a sigh of relief because there are new solutions on the way to help you: 1) increase network capacity and 2) reduce your future cost of bandwidth.

[wp_tech_share]

DellOro Scalable Infra CapexLet’s face it, cable equipment vendors are certainly happy to put 2019 behind them. A glut of DOCSIS channel capacity, the lack of significant competitive threats, and indecision around DAA technologies and timing all resulted in a spending slowdown that lopped off 35% of total DOCSIS infrastructure revenue, year-over-year. Traditional, centralized CCAP platforms bore the brunt of the reductions, with total revenue down 41% year-over-year.

On the bright side of things, each successive quarter in 2019 showed an improvement in scalable infrastructure spending by two of the world’s largest cable operators: Comcast and Charter Communications. In fact, the fourth quarter of 2019 saw a return to a normalized spending level for the combined operators, with Charter having bumped up its spending to increase DOCSIS capacity across strategic areas of its footprint. 2020 should see an improvement in spending by these operators, though again not to the levels seen in 2017 and 2018.

Also on a positive note, spending on Remote PHY equipment and Virtual CCAP platforms were both up solidly for the year, as a growing number of operators began their long-term transition to distributed and virtualized architectures. That trend will only continue to ramp up over the next few years, as operators continue to modernize their networks to push fiber deeper, reduce MERs (Modulation Error Rates,) and reduce the overall costs of operating their broadband access and outside plant networks.

Focus in 2020 Shifts to Upstream Bandwidth

DAA and virtualization are but parts of major network transformation projects many cable operators are beginning or are expected to begin this year. With the DOCSIS 4.0 specification establishing a clear path forward, giving cable operators the flexibility to pursue either Extended Spectrum DOCSIS (ESD) or Full Duplex DOCSIS (FDX), operators can move ahead with their remote PHY and remote MACPHY deployments to solve immediate head-end and power consumption issues.

Also near the top of many operators’ strategic initiatives for 2020 is the resolution of one of the known liabilities of cable broadband networks: limited upstream, or return path, bandwidth. Cable operators recognize that one of the liabilities they have with DOCSIS is its asymmetric design. For the most part, competitors haven’t exploited this liability. But with FTTH being more widely-deployed, they can certainly point at cable’s lack of upstream bandwidth and how that potentially disrupts latency-sensitive applications, such as online gaming, VR, as well as the simple uploading of photos and videos to social media. With a growing number of telcos and ISPs now offering symmetric 1Gbps services, cable operators are facing increasing pressure to expand their upstream capacity.

Most operators are still providing return band of 5-42 MHz. Using a mid-split design can push the upper limits of that band to 85 MHz, with a high split design giving operators up to 204 MHz to work with in the return path. Some large operators have already started or completed their transition to mid-split, while others are jumping directly to a high-split architecture. At 204 MHz, cable operators can offer 1 Gbps of upstream bandwidth, which matches what many telcos are offering through their FTTH networks.

But these upstream upgrades also require significant changes to the outside plant, including amplifiers and taps. For many cable operators, this isn’t necessarily a bad thing, as these critical outside plant components are nearing the end of their lifespan over the next five years, after having served in broadband networks for the last 10-20 years.

vCCAP platforms can serve a key function during this transition, by giving operators more flexibility in the approach they take and which part of the outside is impacted in certain upgrade cycles. When new capacity is required, both downstream and upstream, new vCCAP servers can be quickly added in any location or existing software resources can be re-allocated to those service groups undergoing capacity upgrades. In many cases, those resources can be added much faster than they can be with a centralized CCAP platform, which would require a linecard upgrade at a minimum to support increased capacity.

Though these upgrades put a lot on the plates of cable operators worldwide, the combination of all these transitions will ultimately lead to the complete overhaul and modernization of their broadband access networks, as they continue to migrate down the path towards 1.8 GHz spectrum, Extended Spectrum or Full Duplex DOCSIS modulation, DAA, and virtualization. Again, all these changes will definitely occur in phases, as each operator weighs the vision of their future networks and services against the short- and long-term costs to get there.

[wp_tech_share]

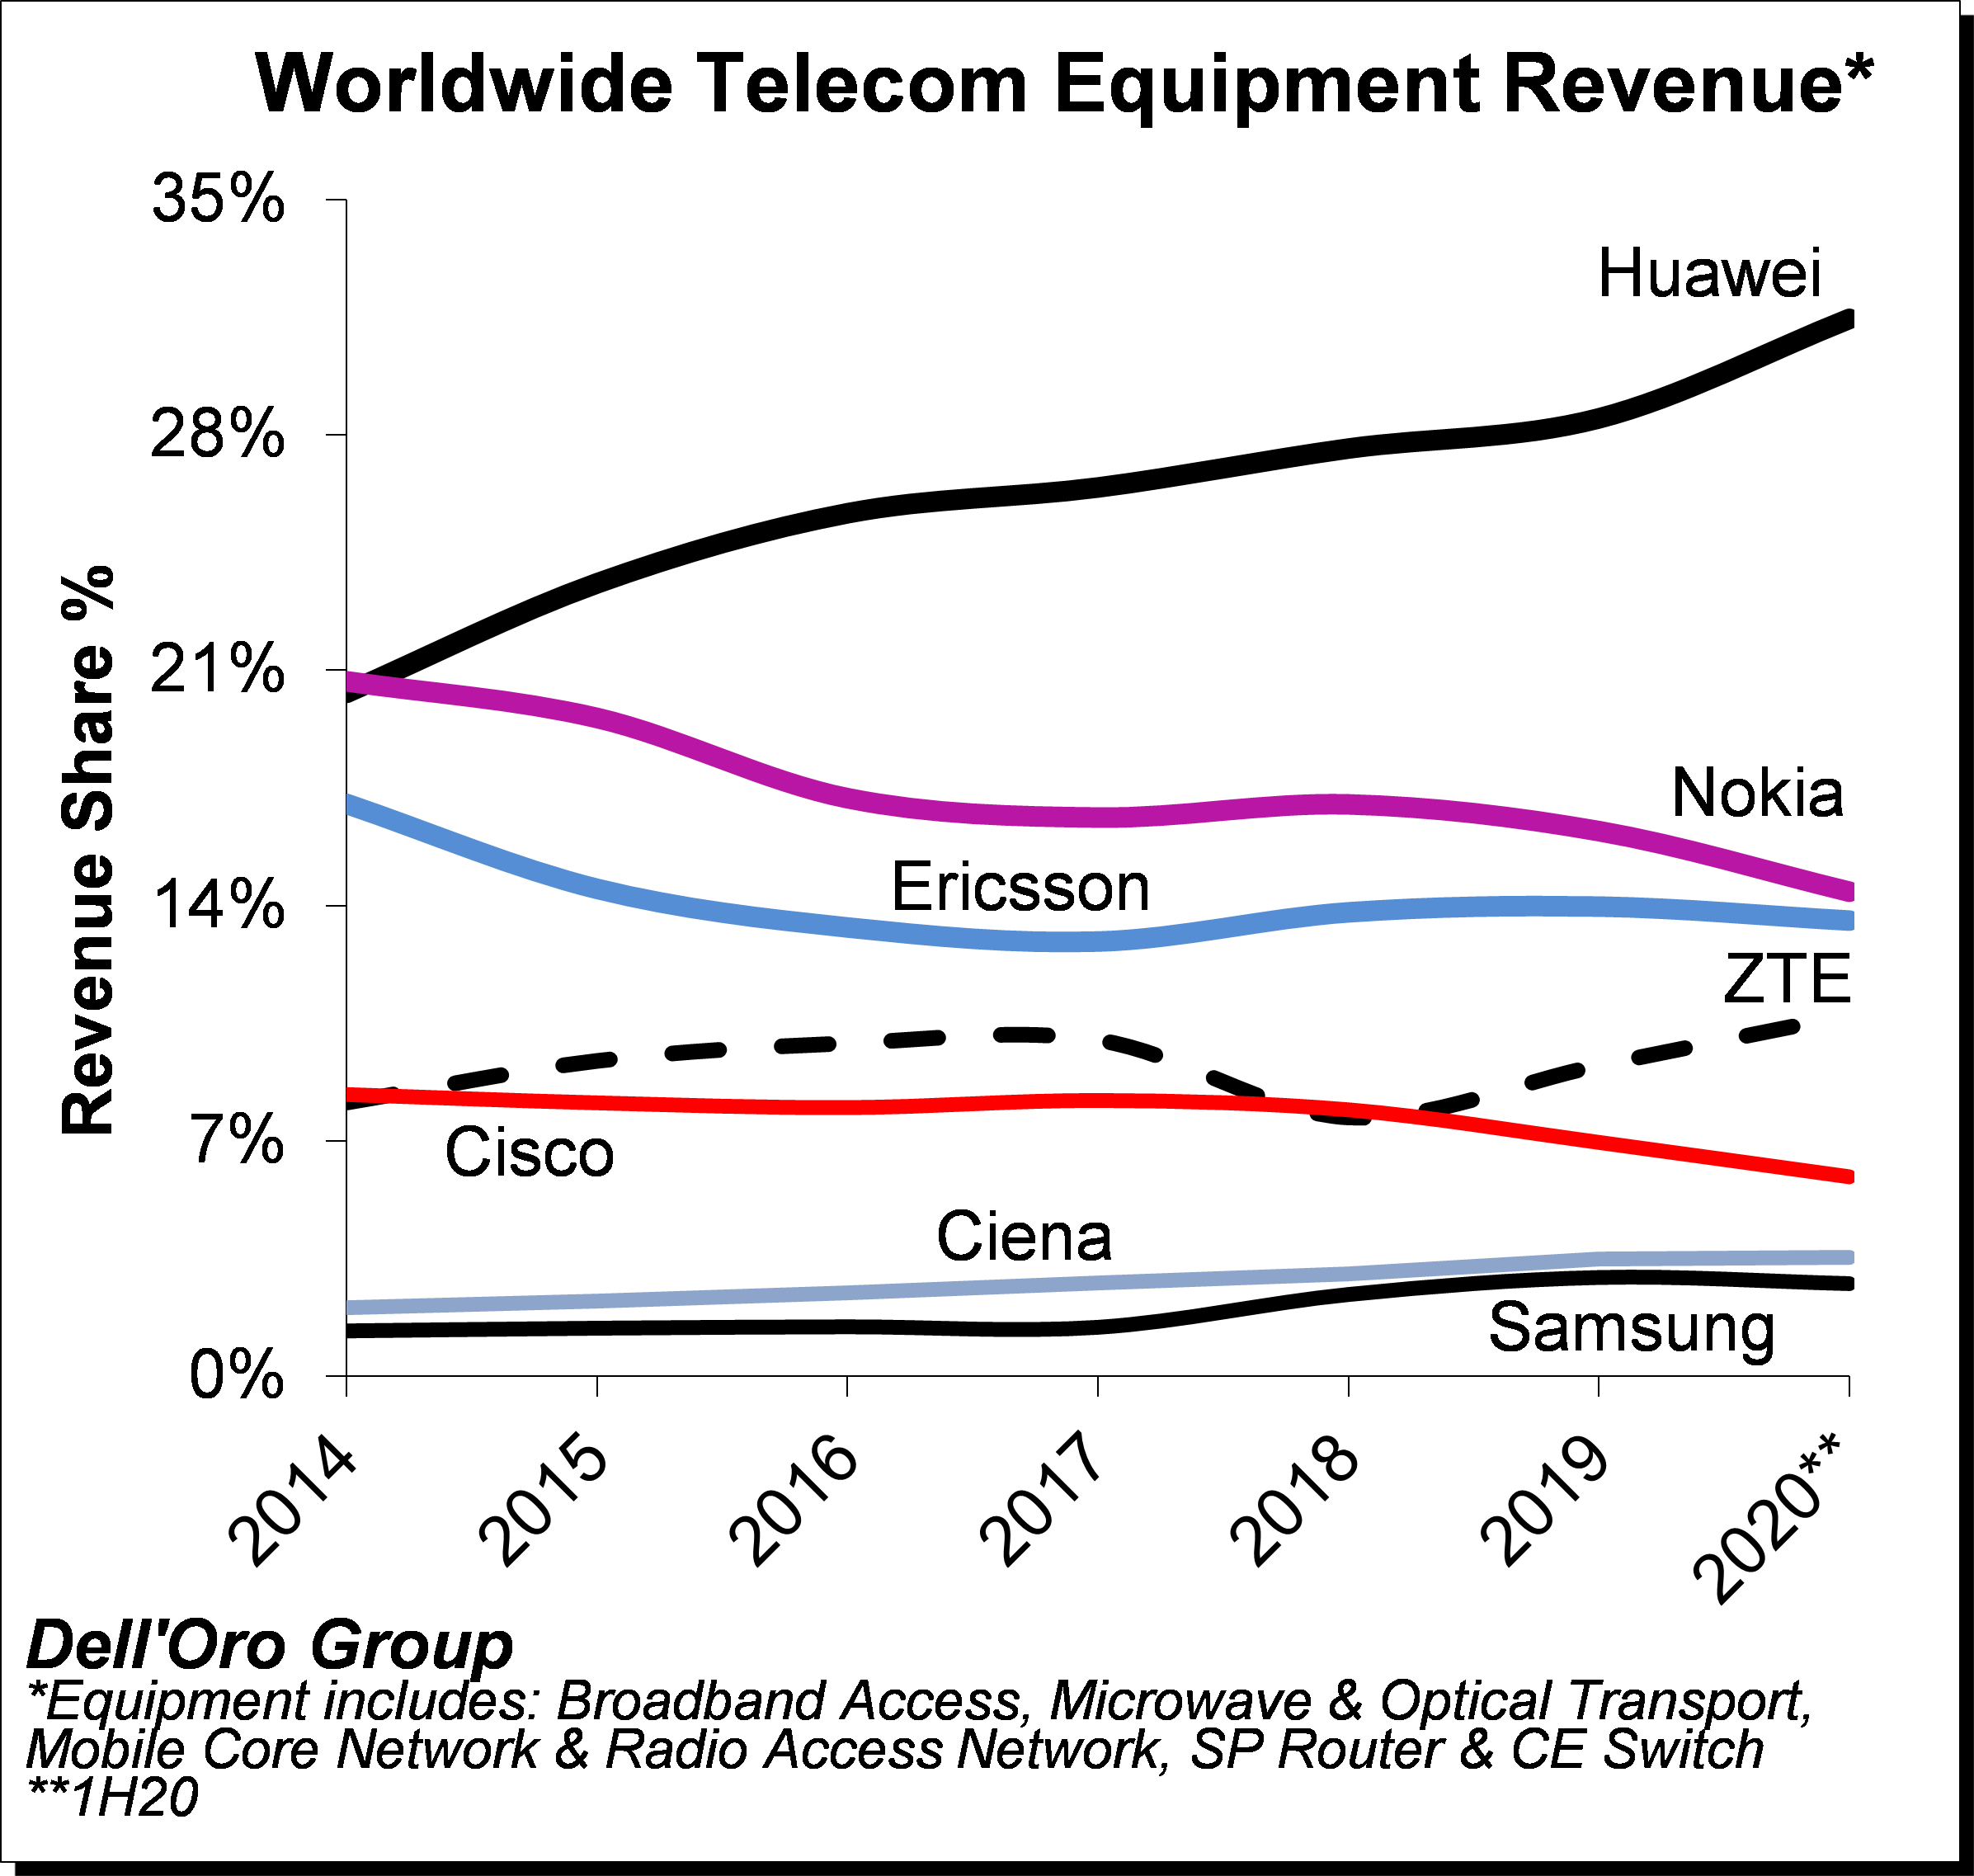
Huawei and ZTE increased their revenue shares while Nokia and Cisco’s revenue shares declined for the full year 2019 telecom equipment market.

We just wrapped up the 2019 reporting period for all the Telecommunications Infrastructure programs covered at Dell’Oro Group. Preliminary estimates suggest the overall telecom equipment market – Broadband Access, Microwave & Optical Transport, Mobile Core & Radio Access Network, SP Router & CE Switch – advanced 2% during 2019, recording a second consecutive year of growth.

Full-year 2019 revenue shares relative to 2018 revenue shares for the top five suppliers – the latter indicated here in parenthesis – show that Huawei, Nokia, Ericsson, ZTE, and Cisco comprised 28% (28%), 16% (17%), 14% (14%), 10% (8%), 7% (8%), respectively.

Additional key takeaways from the 4Q 2019 reporting period include:

  • Following three years of declining revenues between 2014 and 2017, the overall telecom equipment market advanced for a second consecutive year in 2019, validating the message we have communicated for some time now, namely that there are reasons to be excited about the telecom market.
  • Within the technology segments, mid-single digit growth in Optical Transport and RAN was more than enough to offset weaker demand for Microwave Transport and Broadband Access equipment. The two largest equipment markets in the year were Mobile RAN and Optical Transport, together accounting for about 55% of the overall telecom equipment market.
  • The RAN market surprised on the upside and performed better than expected in 2019, propelled by 5G RAN growth that continued to accelerate throughout the year at a torrid pace.
  • The worldwide Optical Transport market continued to expand for a fifth consecutive year, recording the highest growth rate in nearly a decade. Helping to drive this acceleration is robust growth for WDM.
  • Stable demand for PON equipment was not enough to offset declining investments in Cable and DSL, pushing the overall Broadband Access Market to a fourth consecutive year of declining revenues.
  • The efforts by the U.S. government to curb Huawei’s rise has so far had mixed results – we estimate Huawei’s overall telecom equipment share continued to improve in 2019, but the pace of the 2019 share growth was weaker than its average 2014-2019 share growth.
  • ZTE’s revenue share improved by about 2 percentage points in 2019, reflecting a robust recovery since the U.S. ban during 1H18.

Dell’Oro Group telecommunication infrastructure research programs consist of the following: Broadband Access, Microwave Transmission & Mobile Backhaul, Mobile Core Networks, Mobile Radio Access Network (RAN), Optical Transport, Service Provider (SP) Router & Carrier Ethernet Switch, and Telecom Capex.