The millimeter wave (mmWave) narrative has gone through multiple iterations since researchers and industry experts predicted 5G would be all about mmWave back in 2010. As we now know, mmWave accounted for about 1% to 2% of the 2021 RAN market and near-term growth prospects are failing to impress.
Mobile networks continue to advance to support changing supply and demand requirements. In order to manage the rise in mobile data traffic and the diversity of the use case requirements with new technologies, frequencies, and more agile networks without increasing the complexity and costs while still maintaining legacy technologies, mobile networks have to become more intelligent and automated, spurring the need for Intelligent RAN. In this blog, the goal is to update the Intelligent RAN blog we previously posted and review Intelligent RAN drivers, market opportunity, current status, and the ecosystem.
Intelligent RAN Automation Background
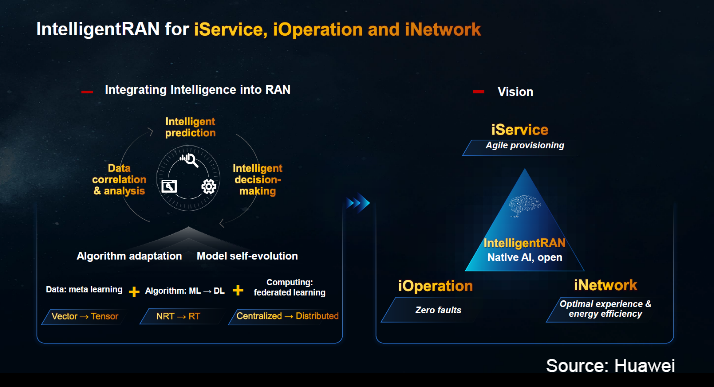
RAN automation and intelligence are not new concepts. In fact, both existing and new 4G and 5G networks rely heavily on automation to replace manual tasks and manage the increased complexity without growing operational costs. But the use of intelligent machine-learning-based functionality embedded in the management system and RAN nodes for real time and non-real time processing is new. The combination of machine learning and automation will enable operators to evolve their 5G networks to the next level by autonomously optimizing resources resulting in improved cost and energy budgets.
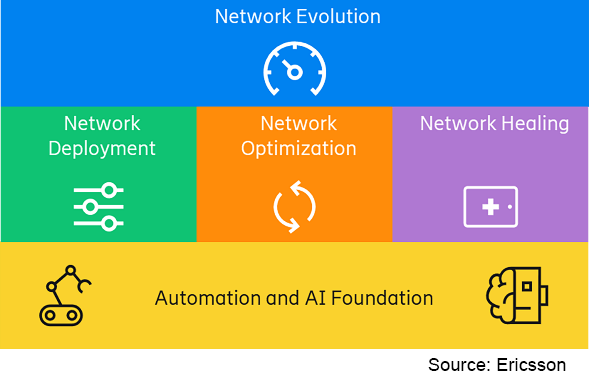
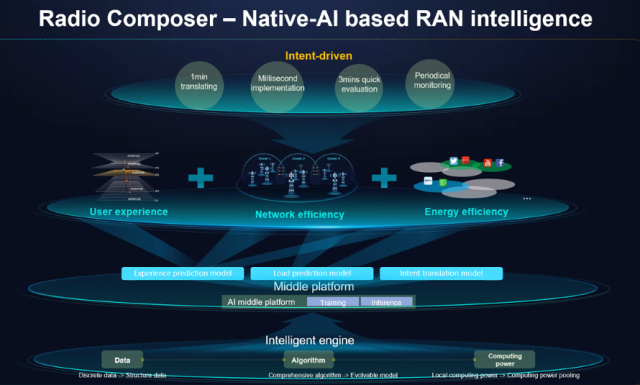
Intelligent RAN Automation is not confined to just the RAN infrastructure. Instead, these solutions will improve performance, reduce energy consumption, and lower costs across multiple infrastructure and service domains. Huawei envisions its IntelligentRAN portfolio will address three key areas, including networks, services, and operations. Similarly, Ericsson’s Intelligent RAN Automation solution is targeting four main areas: Network evolution, network deployment, network optimization, and network healing. And Nokia’s recently launched Intelligent RAN Operations is targeting operational efficiency gains and equipment power savings across multiple domains. ZTE’s radio composer is targeting three key domains, including user experience, network efficiency, and energy efficiency.
 |
 |
Why More RAN Intelligence and Automation?
Operators navigated the LTE era successfully with minimal RAN intelligence. And even if MBB and FWA are now driving the lion’s share of operators’ 5G revenues, we need to keep in mind that 5G is more diverse than LTE from a spectrum, technology, end-user requirements, and applications perspective.
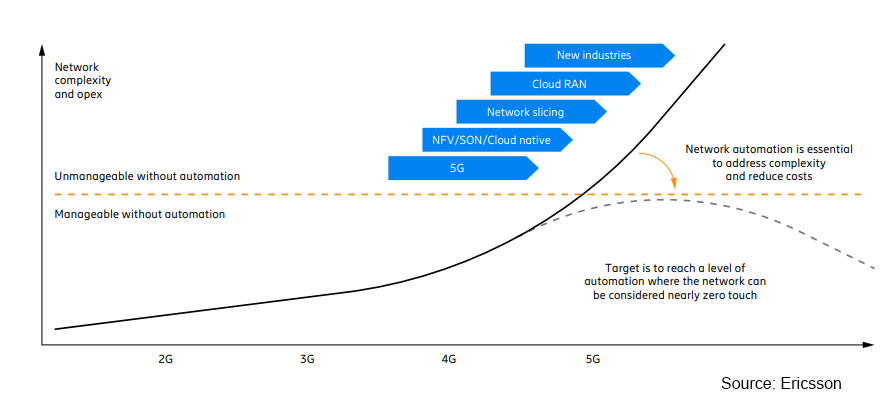
As mobile data traffic continues to grow at an unabated pace while carrier revenue growth remains flat, operators have limited wiggle room to expand capex and opex to manage the increased complexity typically inherent with the technological and architectural advancements required to deliver the appropriate network performance while supporting more demanding and diverse end-user requirements.
Maturing AI capabilities taken together with recent technology advances which allow suppliers to place intelligence inside the base station forms the basis for the uptick in Intelligent RAN.
Leading RAN suppliers envision Intelligent RAN automation will deliver several key benefits:
- Maximize ROI on network investment
- Improve performance and experience
- Boost network quality
- Accelerate time to market
- Reduce complexity
- Reduce energy consumption
- Bring down CO2 emissions
The ongoing shift from proprietary RAN towards disaggregated Open RAN could accelerate innovation, however, costs and complexity of managing multi-vendor deployments could increase if the networks are not effectively managed. According to Ericsson, operator opex could double over the next five years without more automation across deployment and management & operations just to support the expected changes with MBB-driven use cases.
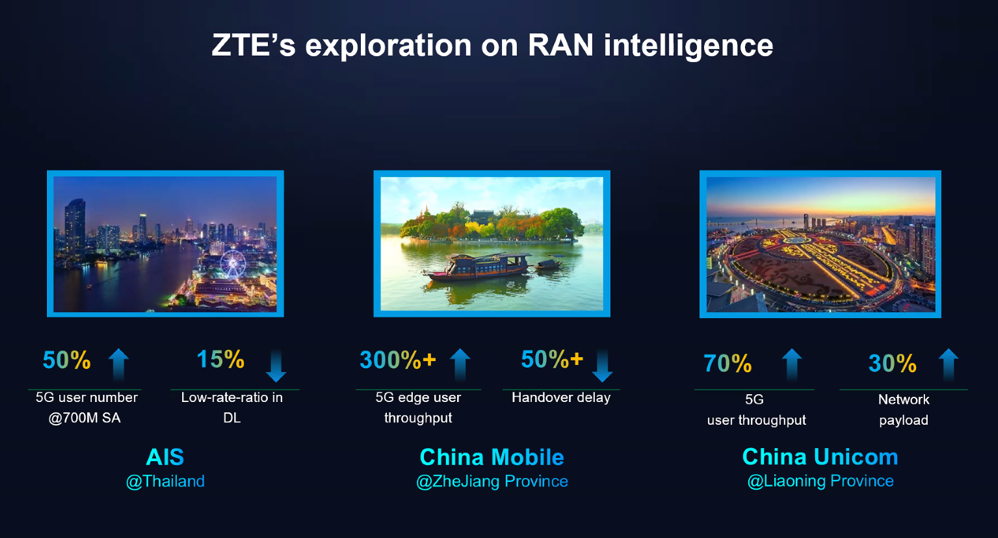
Performance gains underpinned by Intelligent RAN will vary depending on a confluence of factors. Ericsson estimates Intelligent RAN Automation solutions can improve the spectral efficiency by 15% while Huawei has been able to demonstrate that its IntelligentRAN multi-band/multi-site 3D coordination feature can improve the user experience by 50%, in some settings. ZTE and China Mobile have demonstrated a 3x throughput improvements at the cell edge plus a 50% reduction in handover delays.
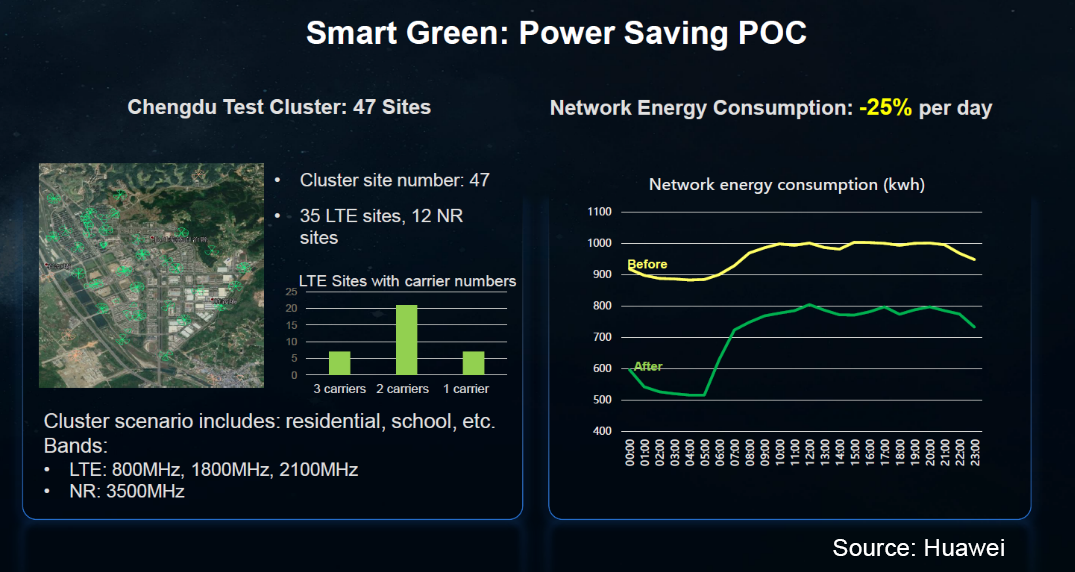
The intensification of climate change taken together with the current power site trajectory forms the basis for the increased focus on energy efficiency and CO2 reduction. Preliminary findings suggest Intelligent RAN can play a pivotal role in curbing emissions, cutting energy consumption by 15% to 25%.
It is still early days in the broader 5G transition, with 5G MBB and FWA in the early majority and early adopter phases, respectively. However, 5G IoT has barely started yet. As private 5G and IoT begin to ramp more meaningfully and diverse use cases comprise a greater share of the overall 5G capex, operators will need to evolve their networks to manage varying latency, throughput, UL, positioning, and reliability requirements. Ultimately it will be extremely challenging to deliver optimal network efficiency across the RAN spectrum with the current networks.
This is why RAN intelligence and automation are increasingly viewed as fundamental elements in the broader digital transformation and autonomy roadmaps. Operators agree AI and automation will be essential components in future networks.
Market Opportunity
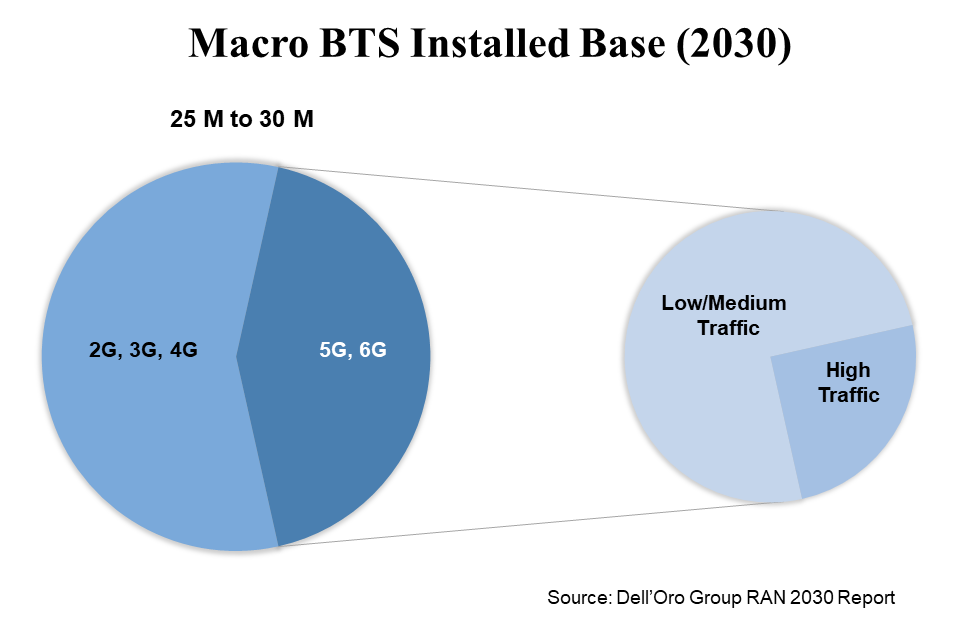
Global RAN revenues have grown at a torrid pace over the past couple of years. And even though RAN market is now entering a period of slower growth, total RAN revenues are projected to top $45 B by 2030, supported by 5G and 6G small cell and macro site expansions.
Intelligent RAN is not going to make sense in all base stations, at least for some time. However, the market opportunity is still significant, especially with high-traffic 5G and 6G sites.
The mix between distributed and centralized intelligence will to some degree be dependent on the fiber footprint as the amount of data to be processed is already large.
Relative to external AI, the local processing inherent with native AI could offer some benefits such as simplified network O&M and reduced costs, especially with low-latency and high-performance service requirements.
Intelligence and Automation Status
RAN Intelligence & Automation is a relatively nascent but growing segment. Rakuten Mobile’s focus on vRAN and automation has enabled the operator to deploy around 0.3 M macro and small cells while maintaining an operational headcount of about 250 people, which is a fraction of that of the typical operator. In the US, greenfield operator Dish is leveraging its cloud-native 5G network and IBM’s AI-powered automation and network orchestration software and services along with VMWare’s RAN Intelligent Controllers to manage costs and to improve performance and innovation for more diverse use cases.
Germany’s fourth operator, 1&1, is building a fully virtualized and open RAN network utilizing specially developed orchestration software to automate operations.
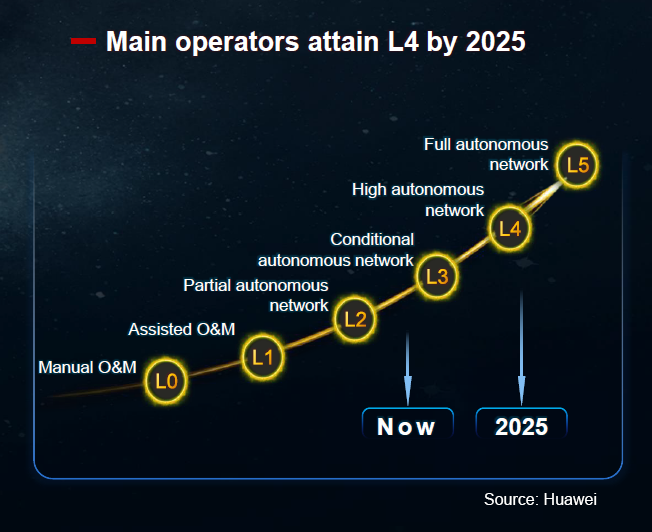
While most of the green field networks are clearly moving towards new architectures that are more automation conducive, change typically does not happen as fast with the brownfields – the average brownfield operator today falls somewhere in between L2 and L3 and still has some way to go before reaching high and full autonomy. Still, China Mobile remains on track for L4 automation by 2025. Per Huawei’s HAS2022 analyst event, the vendor remains optimistic L4 High autonomous network will be more prevalent by the 2025 timeframe. Rakuten Mobile previously said that its network could achieve L4 automation by the end of 2022.
Also, China Mobile has completed numerous AI-powered RAN trials, including one with Nokia’s RIC. The operator has already deployed 10K+ sites using ZTE’s Radio Composer. Meanwhile, China Unicom has implemented a commercial trial of ZTE’s AI solutions, increasing the average high-quality 5G experience duration by 30%.
Vodafone is using RAN Intelligence to boost network quality and to implement Zero Touch Operations. Deutsche Telekom believes the future of the RAN is open and intelligent – the operator is exploring how AI/ML can help with resource optimization and anomaly detections, among other things. Telefonica is working with Nokia to advance RAN intelligence and ultimately optimize the network using AI-based RIC.
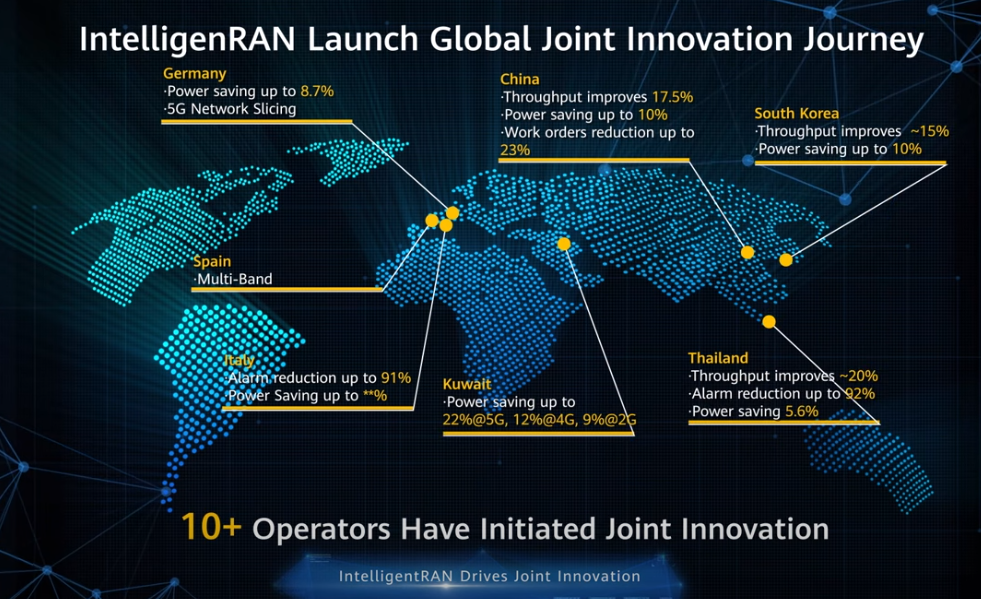
Also, Etisalat, Du, STC, and Zain announced at the SAMENA Telecom Summit that they are collaborating with Huawei to bring more AI into the RAN to improve the performance, reduce downtime, enhance the customer experience, and provide the right foundation for more RAN autonomy. At Huawei’s MBBF 2022 event, the vendor announced it has initiated joint innovation with more than 10 operators.
Vendor Ecosystem
The top 4 RAN players are also heavily focused on improving their Intelligent RAN Automation portfolios. Huawei recently released its IntelligentRAN portfolio and envision its solution, using the Mobile Intelligent Engine (MIE), will be more widely available for both the Site and Network layers by 2023.
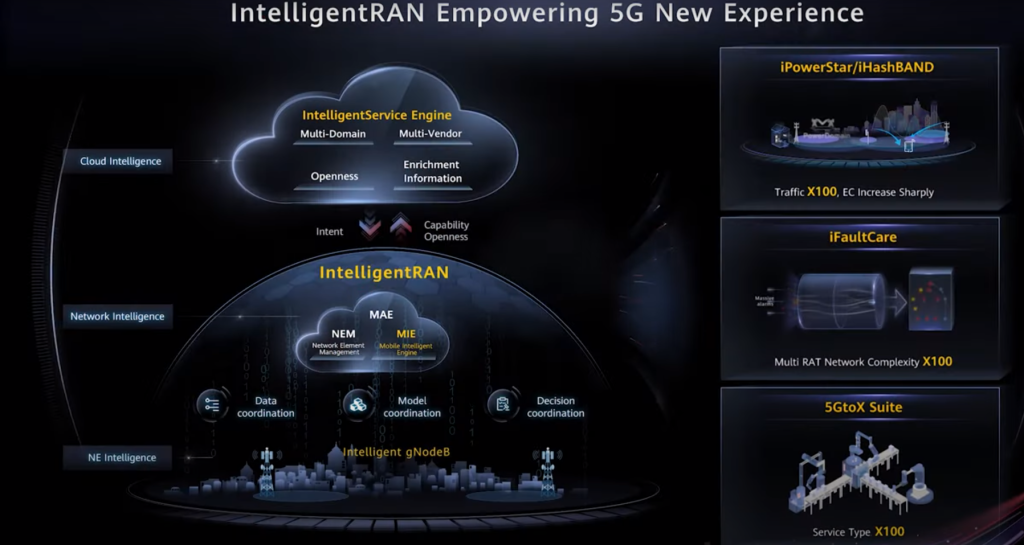
Meanwhile, both Ericsson and Nokia have recently announced enhancements and additions to their Intelligent RAN solutions. Qualcomm recently announced its intent to acquire Cellwize, a RAN SMO and Non-RT RIC supplier.


ZTE’s Radio Composer brings AI-based intelligence into the RAN – the vendor has already successfully demonstrated significant performance improvements in large-scale deployments across China and Thailand.
In addition to the established RAN suppliers, the rise of Open RAN provides an entry point for both smaller RAN suppliers and Non-RAN players such as NEC, Mavenir, Fujitsu, Juniper, and VMware to enter the RIC segment.
AI in 3GPP
The 3GPP standard is continuously evolving to address the broader 5G vision. From an automation and AI perspective, 3GPP already offers a basic foundation that the suppliers can build on to differentiate their solutions.
The network data analytics function (NWDAF) within the 5G Core architecture and defined in 3GPP Release 16, collects data and improves analytics capabilities.
Release 17 adds MDA and Autonomous Networks. As the 3GPP is working on introducing additional AI/ML air interface and RAN improvements with Release 18, suppliers and operators are already bringing early explorations of these technologies to the base station and RAN management systems.
In summary, it is still early days in the 5G journey. Today’s networks are already leveraging automation to manage the increased network complexity. The network of the future will gradually include more automation and AI to provide operators and enterprises with the right tools to proliferate 5G connectivity efficiently. The revenue upside will be limited over the short term, reflecting the fact that it will take some time to overcome non-technology-related challenges including building trust and convincing people to embrace new technologies that ultimately might require humans to acquire new skills to stay relevant. However, the long-term prospects remain healthy.
Today, Ciena announced the acquisition of Tibit Communications and Benu Networks in an effort to control its own destiny in the expanding XGS-PON market and to expand on relationships the company already has with major tier 1 telcos and cable operators for switching, routing, and optical transport.
The company is expecting more significant wins for its platforms, as well as a continued revenue stream from Tibit’s existing supplier relationships—the most notable of which is Harmonic, which uses the Tibit MicroPlugs in its Jetty remote switch module. It will certainly be interesting to see how these two system vendors—now competitors—will manage the relationship going forward, especially when competing for cable operator business—more on that later.
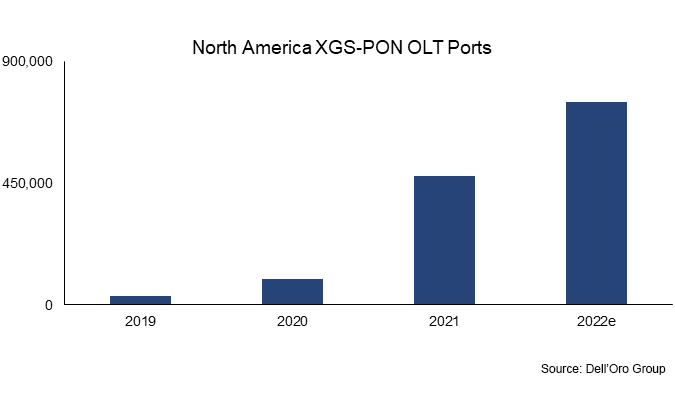
Clearly, the opportunity for Ciena to grow its presence in the broadband access space is now. As we have pointed out, the ongoing levels of both public and private investment in FTTH networks in the North American market remain at historic levels. Total spending by service providers on PON equipment in the region has grown from $774M in 2019 to an expected $1.9B in 2022. The technology with the biggest growth trajectory is clearly XGS-PON. Between 2019 and, XGS-PON OLT port shipments have increased 2231%, jumping from 32k in 2019 to an expected 748k in 2022. It’s likely the numbers in 2022 would be even higher were it not for the lingering supply chain issues that have resulted in considerable vendor backlogs.
With the current investment cycle in XGS-PON, the focus on speed and the need to stay ahead of competitors will likely result in an accelerated adoption of new PON technologies in North America, including 25Gbps and 100Gbps PON. It might seem crazy to think that service providers would move so quickly from a shared subscriber capacity of 10Gbps per OLT port. But if providers are already pushing 5Gbps and 8Gbps tiers, they are going to quickly exhaust their XGS-PON capacity, even with oversubscription. Tibit just happens to be a founding member of the 25GS-PON MSA and, earlier this year, accelerated its efforts to build a 25 Gbps-PON ASIC.
Addressing Smaller Operators’ PON Deployments
Even if service providers’ own fiber investments slow in the next year, as some have speculated, there is no slowing the stimulus efforts of both the federal and state governments. Those contract decisions will be made throughout 2023 with deployments beginning later in the year and through the end of the decade. So, while Ciena works through the lengthy lab cycles at the larger tier 1 operators, it can also address the smaller tier 2 and tier 3 operators who will need to deploy in a shorter time frame to secure their funding.
The combination of Tibit and Benu allows Ciena to address smaller operators with a solution that incorporates both access and aggregation in a single platform, with a hardware-abstracted OLT coupled with a vBNG (from Benu) that can more efficiently address localized areas with smaller subscriber counts. Unlike a traditional deployment in which a local PoP would be set up with a separate OLT, switches, and routers, all homed back to a BNG located in a central office, smaller operators could deploy a Ciena 51xx platform that combines the OLT and switching/routing functions, with a vBNG software stack running in the shared data center. This architecture could speed up the deployment of new fiber services in rural and underserved areas and allow service providers pursuing “edge out” strategies to deploy and connect back to their existing transport networks in a shorter amount of time with less fiber.
Ciena will face solid competition in tier 2 and 3 markets from well-established players, including Adtran, Calix, DZS, and Nokia. All of these vendors understands the value that the combination of access and aggregation brings to smaller operators who are often resource-constrained. It’s a big reason why Adtran acquired Adva and DZS acquired Optelian. Ciena is flipping that model by complementing and expanding its routing, switching, and optical prowess with broadband access platforms. No matter the approach, combining access and aggregation, whether from a single vendor in multiple platforms or in a collapsed platform, is how a growing number of service providers are architecting their broadband access networks. From Verizon to AT&T to dozens of other telcos, collapsing access and aggregation networks onto fiber with Ethernet transport is the logical evolution of their networks. It reduces the total number of network elements and reduces operational costs.
Cable Provides Strong Upside
Earlier, we mentioned the fact that Ciena is not Tibit’s lone customer. Harmonic is also a fast-growing customer of the Tibit MicroPlugs, pairing them with its CableOS platform for BNG, routing, and DOCSIS provisioning functions. Though we don’t expect to see any changes in the business relationship between Ciena and Harmonic in the short term, they may find themselves competing with each other for some marquee cable customers. In fact, they might already be doing so.
With cable operators in North America and Europe facing significant competition from fiber overbuilders, the pressure is on for them to expand their own fiber footprint, extending beyond new builds to overbuild scenarios. For a growing list of smaller cable operators in North America, that has certainly been their strategy and will continue to be, as DOCSIS 3.1 will likely be the last HFC technology they ever use.
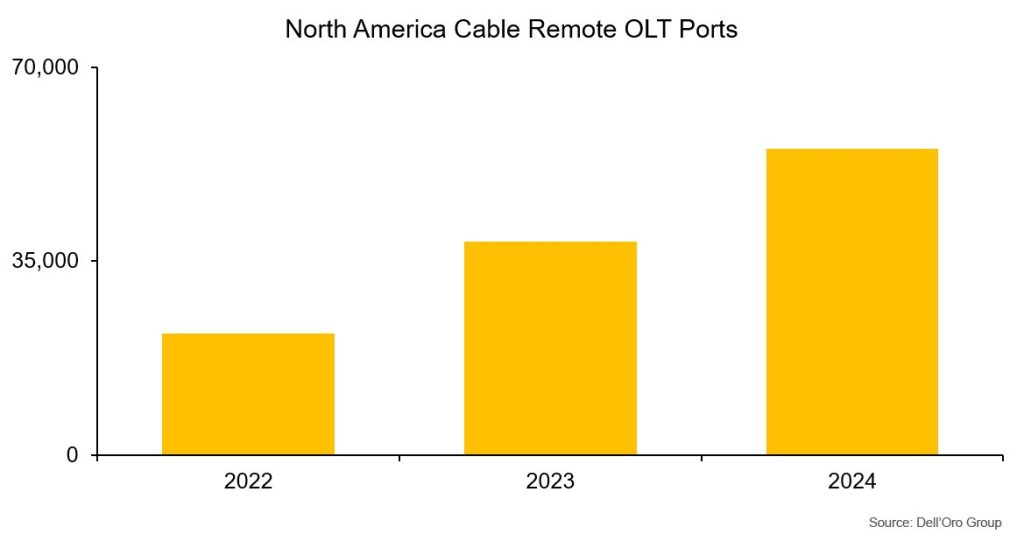
Even tier 1 operators in Europe, including Liberty Global and Vodafone, have already begun significant fiber overbuilds. The net result is a steady and significant growth in the number of remote OLT ports shipped—particularly in North America, where edge-out strategies and retrofitting existing node locations is a quick way to expand fiber footprint.
But even among the North American tier 1 operators, who have made public commitments to DOCSIS 4.0, there is an acknowledgment that FTTH deployments have been made far easier architecturally partially because of the Tibit MicroPlug. Even though there are differences among the largest multiple-systems operators (MSOs) regarding specific technical approaches to DOCSIS 4.0 and their access networks, in general, there is consensus that distributed access architectures are the future. The HFC-based architectural options of DAA are Remote PHY and Remote MACPHY. For fiber, however, we classify Remote OLTs as just another flavor of DAA. R-OLTs, especially based on the Tibit architecture, essentially function like R-MACPHY. With a BNG and some type of DOCSIS translation engine, MSOs can provision their fiber subscribers just like they would their DOCSIS subscribers.
In those scenarios, Harmonic has a clear edge, having a vCMTS platform that can work with both Remote PHY Devices (RPDs) in DOCSIS deployments and also R-OLTs in FTTH deployments.
But for cable operators who are moving away from DOCSIS provisioning and fully embracing fiber, the need for a vCMTS isn’t as strong. So, that opens the door for companies like Ciena, as well as Calix, Adtran, Vecima, DZS, and others.
The more interesting scenario in the cable world, and the one with the most upside for Ciena, is the one where a vCMTS platform is already in place and the remote OLT platform remains an open competition. In that case, there are large MSOs who value an R-OLT that combines access and aggregation to dramatically simplify their CIN (Converged Interconnect Network). A remote platform that can function as both an OLT but also as a router for other nodes in the network collapses multiple network layers and simplifies transport back to the headend.
Though the biggest opportunities still rest with the tier 1 telcos, there is enough upside among both smaller telcos and cable operators to make these acquisitions pay off for Ciena both in the short- and long-term. The transactions send a further signal that the distribution of access network and subscriber management elements along with the abstraction of OLT hardware remain strategic initiatives for many operators.
400 Gbps Market Demand
A significant shift towards 400 Gpbs-capable routers is underway, driven by the global need to upgrade IP backbones. In the first half of 2022, 400 Gbps router port shipments grew over 140% Y/Y, and we expect that momentum to continue through 2026, with revenues increasing from 15-20% of total router port revenue in 2022 to 30-35% by 2026.
We estimate the market opportunity for 400 Gbps-capable routers at roughly $17 B for the five-year period from 2022 to 2026. The combined market opportunity for the 400 and 100 Gbps-capable routers is estimated to exceed $36 B for the same period, as network operators continue to deploy 400 Gbps ports to deliver 4×100 Gbps connections using breakout modules and adapters, as well as software activation keys.
Internet backbone/IP backbone network upgrades represent the highest demand for 400 Gbps routers because the Internet backbone includes both Cloud and Telco service provider (SP) networks and transports traffic from Mobile and Broadband service networks and Cloud infrastructure. We expect that most 400 Gbps router ports will be deployed in IP backbone networks over the next five years and that 400 Gbps technology will lead the next phase of internet backbone expansion.
Largest Buyers
We believe that Cloud SPs were the first to adopt 400 Gbps routers, beginning with large-scale backbone network deployments in 2021. As they aggressively enrich their service offerings and expand their customer bases, we believe that Cloud SPs are expanding their network infrastructure faster than Telco SPs. However, the market opportunity generated by Cloud SPs is relatively small compared to that of Telco SPs. Over the next five years, we estimate that Cloud SPs will account for about a third of the Core Router Market.
Telecom SPs are adopting 400 Gbps technology on a large scale by deploying 400 Gbps routers in diverse network topologies and in a range of configurations to accommodate a variety of service offerings. Telco SP networks and service offerings are more mature than those of Cloud SPs. Because of the different network topologies and purposes, the demand drivers for Telcos deploying 400 Gbps routers in their networks are unique, as well. Telco SPs typically do not rip and replace network equipment but rather gradually upgrade outdated devices and expand capacity when needed.
Driving Forces Behind the 400Gbps Router Adoption
Network operators are now adding 400 Gbps ports in their backbone networks for two primary reasons: economic efficiency and increased traffic levels. By using the newest generation of high-capacity ASICs, 400 Gbps routers offer the benefits of higher speeds per port with decreased energy consumption, thus reducing the total number of ports required and, in turn, the size of the chassis, saving valuable rack space. The higher speed per port also lowers the cost per bit per port, because the cost of one 400 Gbps port is typically lower than the cost of four 100 Gbps ports. Combined with the reduced energy consumption and the smaller, space-saving format of the router, transitioning to 400 Gbps ports enables SPs to make more economically efficient investments and lower operating costs.
Before 2021, Telco SPs did not make substantial investments in core networks to accommodate the significant traffic growth that occurred during the Covid-19 pandemic. Contrary to general expectation, traffic volumes in SP networks have not fallen to pre-pandemic levels as the pandemic has eased. We believe that many SPs are investing to reset capacity and align their networks to satisfy traffic growth expectations. We predict a rapid growth in demand for 400 Gbps routers that will transform network capacity over the next five years.
Capacity Demand on the Rise
5G RAN deployments are leading to a rapid expansion of mobile networks, with a two-fold effect. First, mobile SPs need to expand their mobile transport networks and are deploying 400 Gbps routers to do so. Second, 5G technology enables higher mobile internet connection speeds, which encourage mobile network customers to consume data-heavy media content and thus drive up traffic volumes in SP networks.
Major broadband SPs around the world are expanding their fiber infrastructure buildouts by taking advantage of government subsidies along with substantial private investments. According to Jeff Heynen, VP analyst for Broadband Access & Home Networking, fiber homes passed goals for many operators are easily double or triple their homes passed currently. The net result will be a massive shift to fiber broadband over the next decade, with baseline speeds of symmetric 1-5 Gbps per household.
Work-from-home and hybrid work models, along with online learning models established during the pandemic, are sustaining and continuing to drive increasing numbers of broadband subscriptions, which also result in higher network traffic levels. Fixed broadband subscriptions in homes and businesses have now been cemented as an essential service. Although it was expected that broadband subscriptions would decline as workers returned to their offices and students returned to school, subscriber additions accelerated throughout 2021 and into 1H22.
Media content services offered by Cloud SPs are also driving the growth of Telco SP network traffic. Cloud-based video, music streaming, and gaming platforms—such as Netflix, Google TV, YouTube, Amazon Prime, and Spotify—require high-speed (high-bandwidth) internet connections and typically create a high volume of internet traffic across Telco SP networks.
Given the expected traffic growth across backbone networks around the world, we believe the increasing adoption of 400 Gbps-capable routers by Cloud and Telco SPs aiming to improve economic efficiency and optimize network capacity will transform the SP Router market and lead the next phase of internet backbone expansion.
5G deployments have come a long way in just a few years, already fueling more than 60% of the global RAN market. Adoption across the various use cases, however, has been mixed, with 3GPP-based Release 15 networks targeting the Mobile Broadband (MBB) usage scenario, supporting more than 95% of the investments to date. This bifurcation between MBB and IoT/Private 5G—together with the fact that some of the more advanced 5G markets are now covering 5G MBB nationwide—is propelling key participants in the ecosystem to prepare for the next phase in the 5G journey. In this blog, we will review 5G-Advanced: what it is, what is required to make it a success, and its implications for the RAN forecast.
What is 5G-Advanced/5.5G?
The 3GPP roadmap is continuously evolving to fulfill the larger 5G vision. In this initial 5G wave that began in 2018, 3GPP has already completed three major releases: 15, 16, and 17.
The schedule for 3GPP Release 15 included three separate steps: the early drop, focusing on NSA option 3; the main drop, focusing on SA option 2; and the late drop, focusing on completion of 4G to 5G migration architectures. While MBB is dominating the capex mix in this initial 5G phase, the 3GPP roadmap is advancing to address opportunities beyond MBB.
Release 16, also known as Phase 2, was completed in July 2020. The high-level vision is that Release 16 will provide the initial foundation for taking 5G to the next level beyond the MBB phase, targeting broad-based enhancements for 5G V2X, Industrial IoT/URLLC, and NR-U.
Release 17, also known as continued 5G expansion, was completed in early 2022. This 5G version provides more enhancements, extending operations up to 71 GHz with enhancements to IoT, Massive MIMO, Non-terrestrial networks (NTN), and DSS, among other things. With 3GPP Rel-17, a new device type (“NR Light”) was introduced, to address industrial sensors.
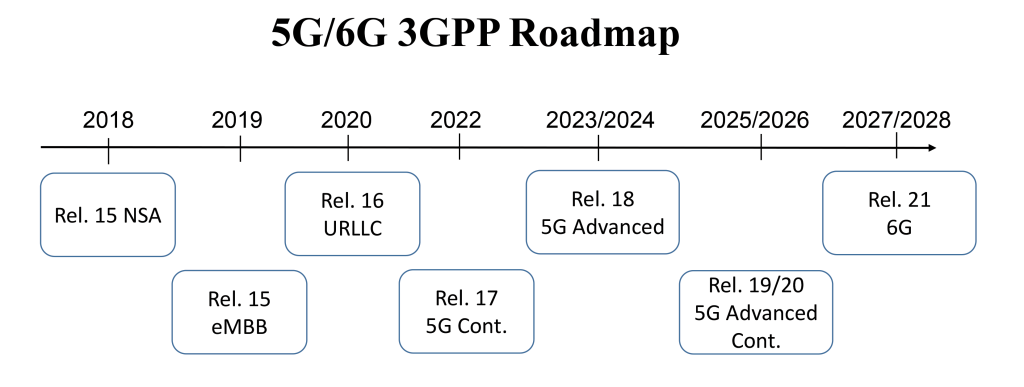
These initial releases have been key to the success of both MBB and FWA. But there are still shortcomings that need to be addressed, in order to fulfill the broader 5G vision. The current thinking with Release 18 and beyond (5G-Advanced or 5.5G) is that it will take 5G to the next level, creating a foundation for more demanding applications and a broader set of use cases. Nokia has articulated a vision in which 5G-Advanced helps improve experience, expand capabilities, extend the reach of connectivity, and spur operational enhancements.

Huawei is marketing the 5G-Advanced evolution as 1+1+N or 5.5G, to reflect the additional layer needed to realize ubiquitous Gbps speeds (current 5G is marketed as 1+N, where 1 represents the foundation network and N refers to the various capabilities and scenarios).
As expressed at Huawei’s most recent Huawei Connect 2022 summit, Huawei envisions that 5.5 G represents an important stepping stone toward a more intelligent world, utilizing AI and ML to improve customer experience and to autonomously optimize resources, ultimately reducing cost and energy budgets for the operators. Huawei also sees 5.5G as an important milestone on the path to improving overall capacity before 6G, based on the belief that 5G-Advanced can provide the right framework for delivering ubiquitous Gbit/s performance.
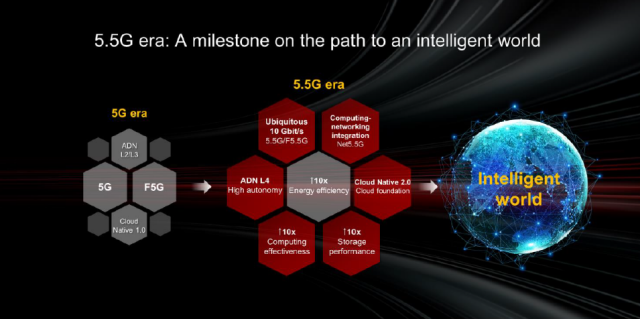
Ericsson also sees 5G-Advanced as an important extension in the 5G journey, envisioning that AI/ML will play an increasingly important role in supporting new applications and use cases.
Current Release 18 priorities may be summarized as follows:
- UL coverage enhancement
- Intelligent network automation (AI/ML RAN and core enhancements, NR data collection)
- Flexible spectrum (DSS, CA enhancements, FRMCS < 5 MHz)
- Energy savings
- Critical IoT (Deterministic Networking, NR-Light evolution/reduced capability)
- NTN enhancements (satellite-terrestrial integration)
What is needed for 5G-Advanced to become a success?
The majority of the features and enhancements currently outlined with 3GPP Release 18 will deliver incremental performance gains. In order for 5G-Advanced to drive another capex and marketing cycle and ultimately become something more than just another 3GPP release, multiple things need to happen.
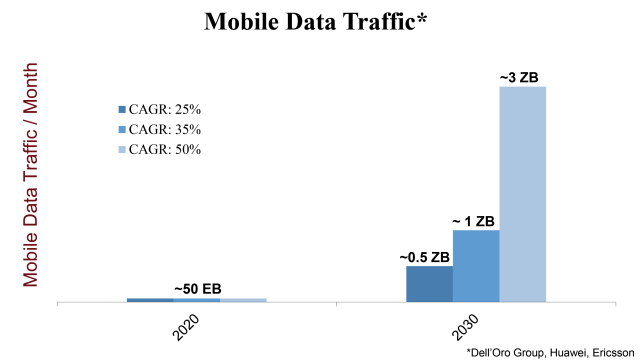
For one thing, mobile data traffic consumption needs to increase. According to Ericsson’s mobility report, global mobile data traffic increased 35–40% in 2021 and is projected to advance at a 30% CAGR over the next five years. At these rates of growth, existing sub-6 GHz and Millimeter Wave (mmWave) spectrum allocations will be more than enough to support another 10x of mobile data traffic expansion by 2030.
But the same cannot be said if we move to a video-first world with the mobile network. With the typical phone user still spending less than 5% of total smartphone screen time streaming videos on the wireless network, the successful introduction of a new virtual reality (VR) or augmented reality (AR) device for the masses that would trigger a change in behavior—increasing the amount of time users spend consuming video on the mobile network—would from a RAN capacity perspective be a game changer, likely spurring massive capacity investments.
In this case, more spectrum would play a critical role in the broader capacity roadmap. The challenge here is that new near-term sub-6 GHz opportunities are currently confined to the Upper-6 GHz spectrum, which still lacks global coordination as a result of some countries questioning the commercial viability of allocating parts of or the entire 6 GHz band for 5G.
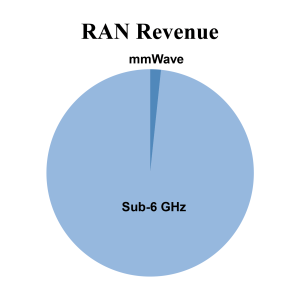
The implication is that the role of the mmWave spectrum will need to change. While mmWave has come a long way in just a few years, the reality is that the sub-6GHz spectrum continues to represent the most economical solution, enabling operators to minimize the need for incremental cell sites. Not surprisingly, mmWave still comprises less than 2% of global RAN investments. Technological breakthroughs combined with repeater improvements and increased use of reflective intelligent surfaces (RIS) will help to shrink the cost per GB gap between the sub-6 GHz spectrum and mmWave, ultimately putting this spectrum to better use.
Since all LTE spectrum will eventually become 5G spectrum, DSS enhancements that can improve the spectral efficiency with 5G during various LTE load conditions should improve the DSS business case, thereby enabling operators to accelerate the shift from 4G to 5G.
Cellular IoT (CIoT), including Broadband and Massive IoT, continues to be successfully deployed across the world. According to the GSA and Ericsson’s Mobility Report, global CIoT connections approached 2B in 2021, up roughly two-fold since 2019. Still, CIoT accounts for a low single-digit share of total mobile data traffic and operator revenues. Although LTE is expected to address the lion’s share of the CIoT connections for the foreseeable future, a stronger focus on Deterministic Networking (DetNet), combined with technological innovation in IoT that can improve uplink rates and location precision, could provide a boost in some industrial settings.
5G RAN Implications
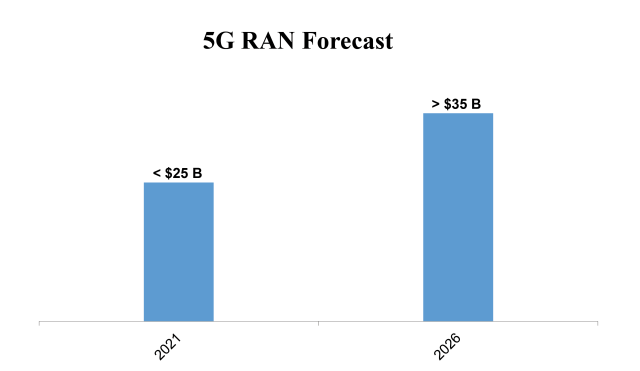
Following a couple years of exponential growth, 5G RAN investments are slowing. At the same time, it is still early in the broader 5G cycle. The message we have communicated for some time still holds: Our baseline scenario rests on the assumption that the 5G cycle will be longer and deeper than the LTE investment phase. And even though the base case is not predicated on the assumption that 5G-Advanced will drive another capex cycle, Release 18 and future releases are expected to play important roles in this next part of the 5G journey.
Beyond the RAN
The RAN is just one piece of the larger connectivity puzzle. As Huawei representatives pointed out during the company’s Connect 2022 Summit, the shift toward 5G-Advanced needs to be accompanied by improvements in core, storage, computing, optical, and data communications, to name just a few areas. ETSI just released another white paper focusing on the standards for fiber F5G Evolution, with the idea that more regular enhancements to the fixed network—combined with greater collaboration—will improve the synchronization between wireless and fixed evolutions.
We plan to discuss these topics further in future blogs. For more information about the 5G RAN forecast, please see the latest 5G Report.