The rise of accelerated computing for applications such as AI and ML over the last several years has led to new innovations in the areas of compute, networking, and rack infrastructure. Accelerated computing generally refers to servers that are equipped with coprocessors such as GPUs and other custom accelerators. These accelerated servers are deployed as a system consisting of low-latency networking fabric, and enhanced thermal management to accommodate the higher power envelope.
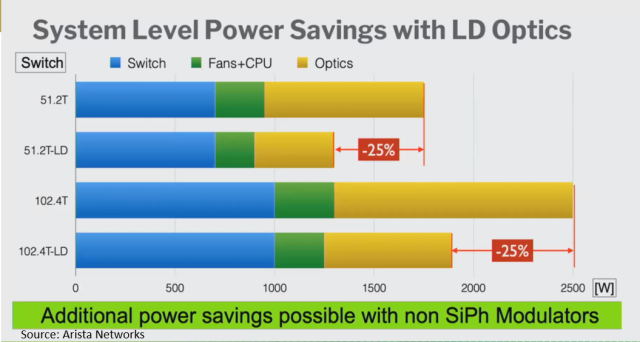
Today, data centers account for approximately 2% of the global energy usage. While the latest accelerated server can consume up to 6kW of power each and may seem counterintuitive from a sustainability perspective, accelerated systems are actually more energy efficient compared to general-purpose servers when matched to the right mix of workloads. The advent of generative AI has significantly raised the threshold in compute and network demands, given that these language models consist of billions of parameters. Accelerators can help to train these large language models within a practical timeframe.
Deployment of these AI language models usually consists of two distinct stages: training and inference.
- In AI training, data is fed into the model, so the model learns about the type of data to be analyzed. AI training is generally more infrastructure intensive, consisting of one to thousands of interconnected servers with multiple accelerators (such as GPUs and custom coprocessors) per server. We classify accelerators for training as “high-end” and examples include NVIDIA H100, Intel Gaudi2, AMD MI250, or custom processors such as the Google TPU.
- In AI inference, the trained model is used to make predictions based on live data. AI inference servers may be equipped with discrete accelerators (such as GPUs, FPGAs, or custom processors) or embedded accelerators in the CPU. We classify accelerators for inference as “low-end” and examples include NVIDIA T4 or L40S. In some cases, AI inference servers are classified as general-purpose servers because of the lack of discrete accelerators.
Server Usage: Training vs. Inference?
A common question that has been asked is how much of the infrastructure, typically measured by the number of servers, is deployed for training as opposed to inference applications, and what is the adoption rate of each type of platform? This is a question that we have been investigating and debating, and the following factors complicate the analysis.
- NVIDIA’s recent GPU offerings based on the A100 Ampere and H100 Hopper platforms are intended to support both training and inference. These platforms typically consist of a large array of multi-GPU servers that are interconnected and well-suited for training large language models. However, any excess capacity not used for training can be utilized towards inference workloads. While inference workloads typically do not require a large array of servers (although inference applications are increasing in size), inference applications can be deployed for multiple tenants through virtualization.
- The latest CPUs from Intel and AMD have embedded accelerators on the CPU that are optimized for inference applications. Thus, a monolithic architecture without discrete accelerators is ideal as capacity can be shared by both traditional and inference workloads.
- The chip vendors also sell GPUs and other accelerators not as systems but as PCI Express add-in cards. One or several of these accelerator add-in cards can be installed by the end-user after the sale of the system.
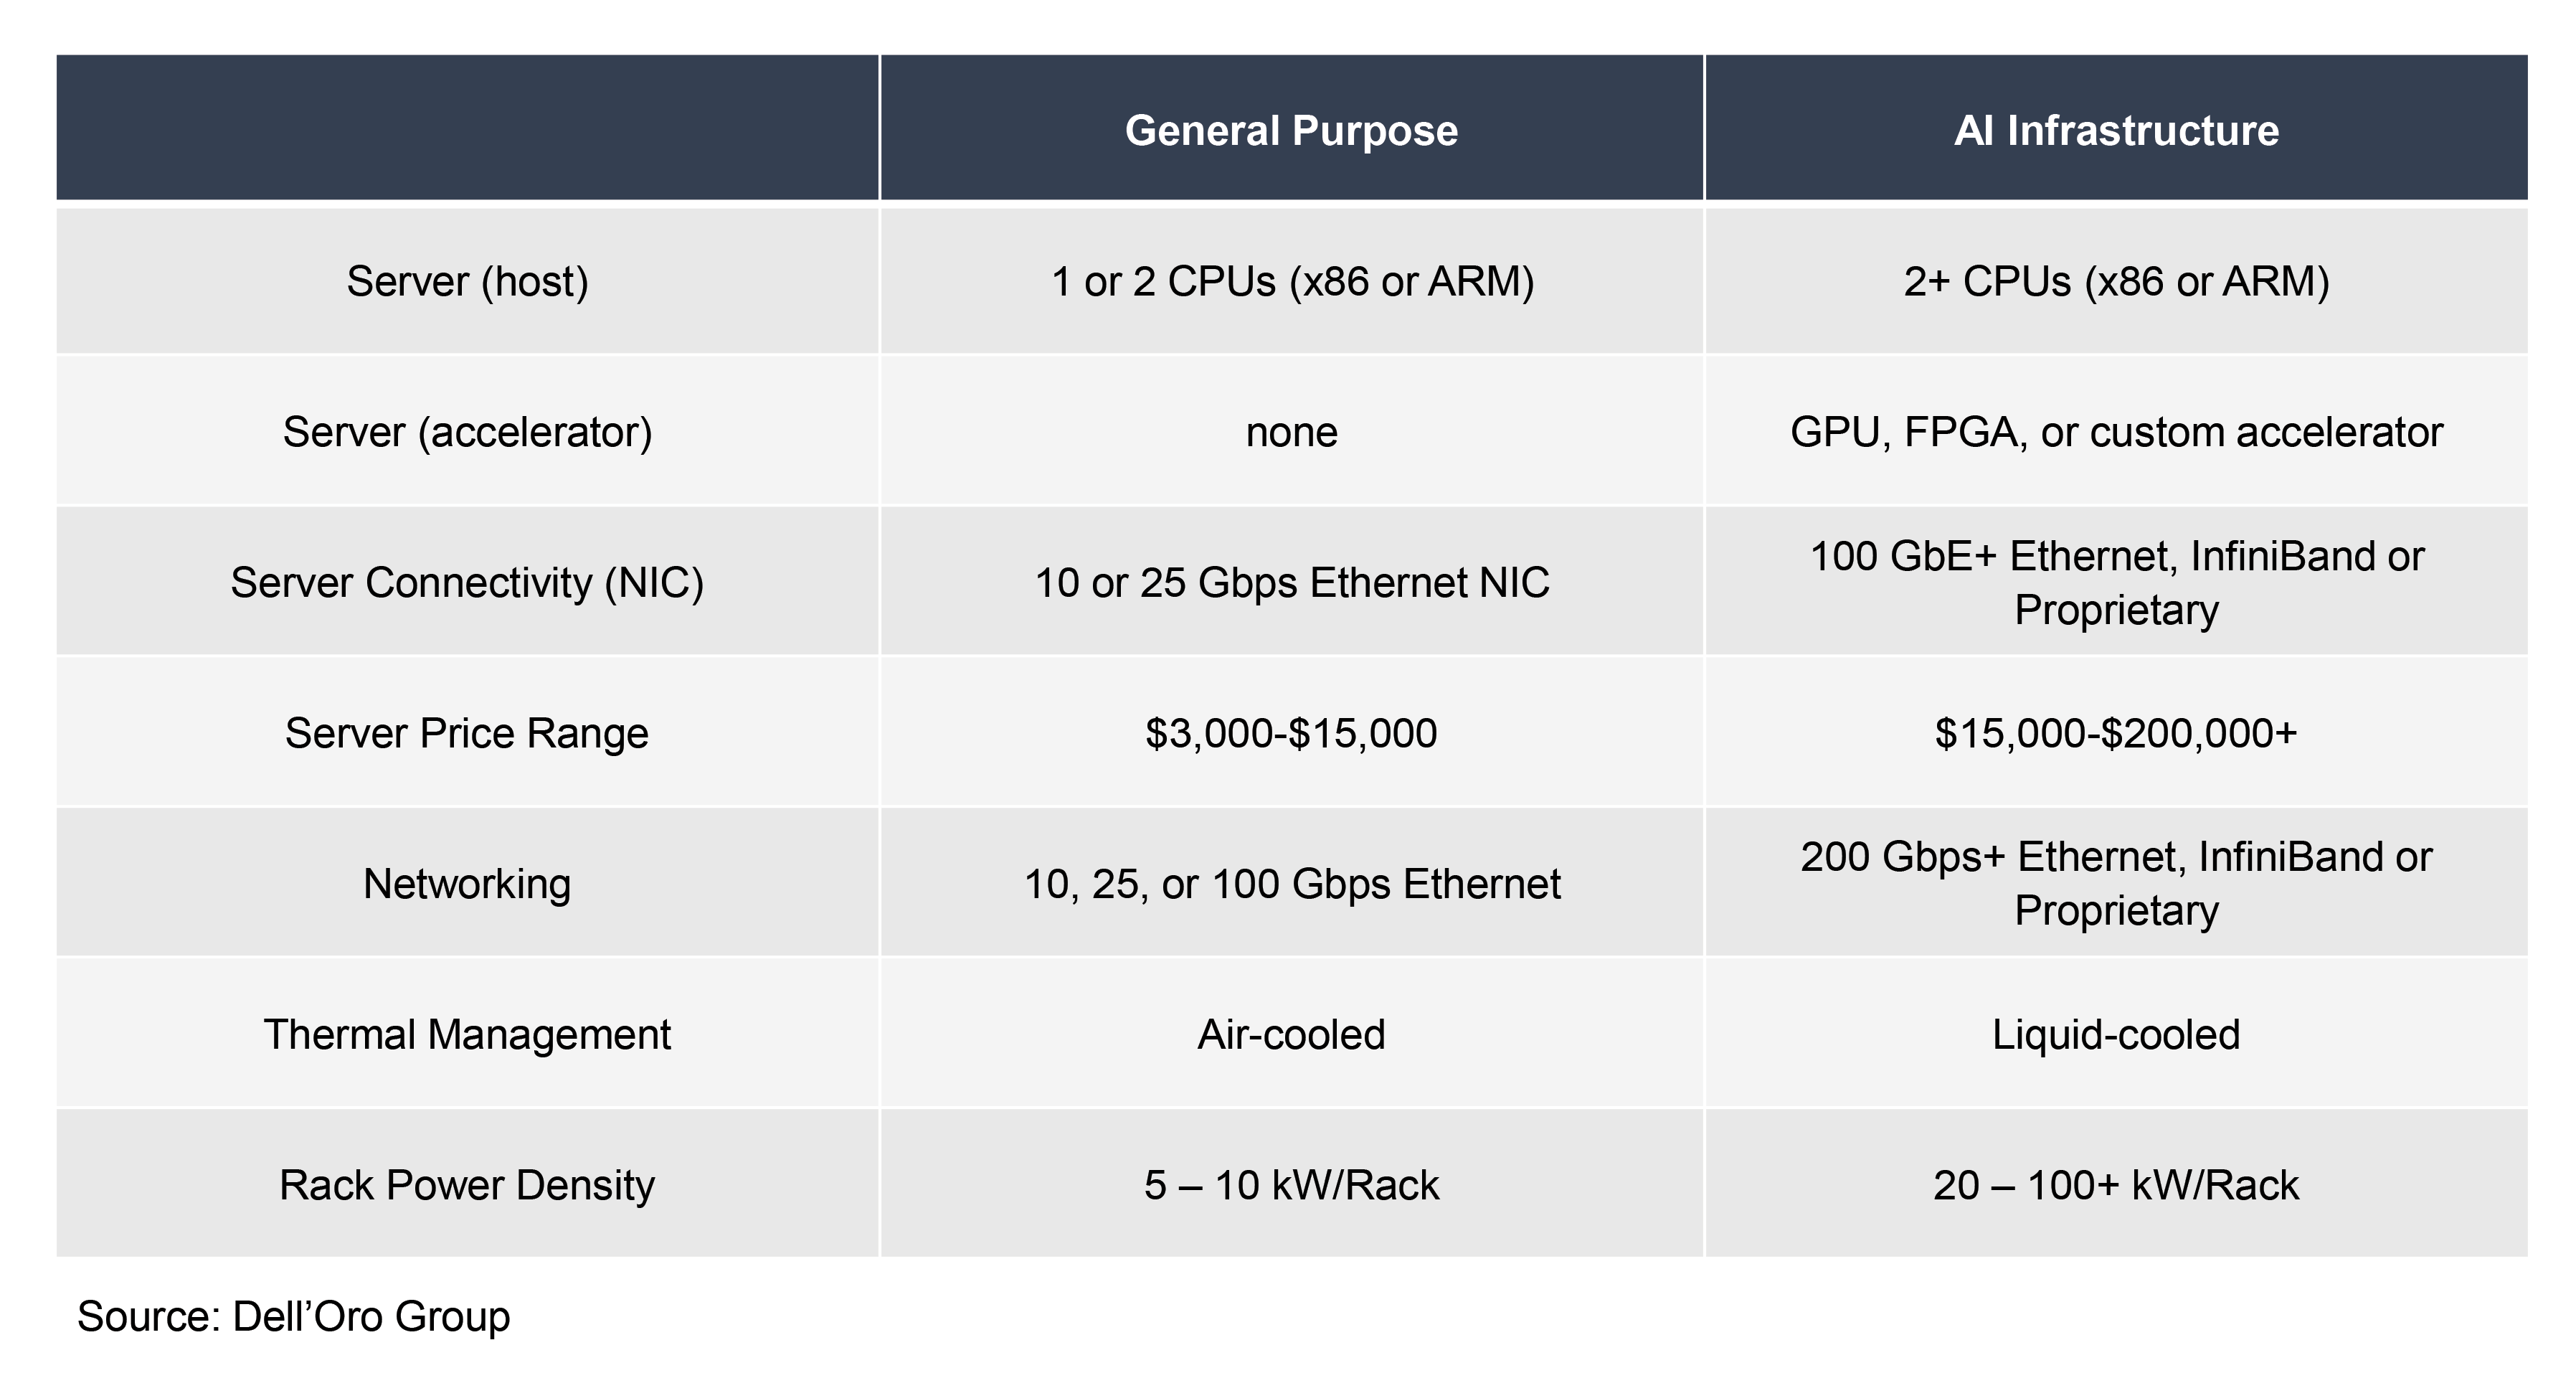
Given that different workloads (training, inference, and traditional) can be shared on one type of system, and that end-users can reconfigure the systems with discrete accelerators, it becomes less meaningful to delineate the market purely by workload type. Instead, we segment the market by three distinct types of server platform types as defined in Figure 1.
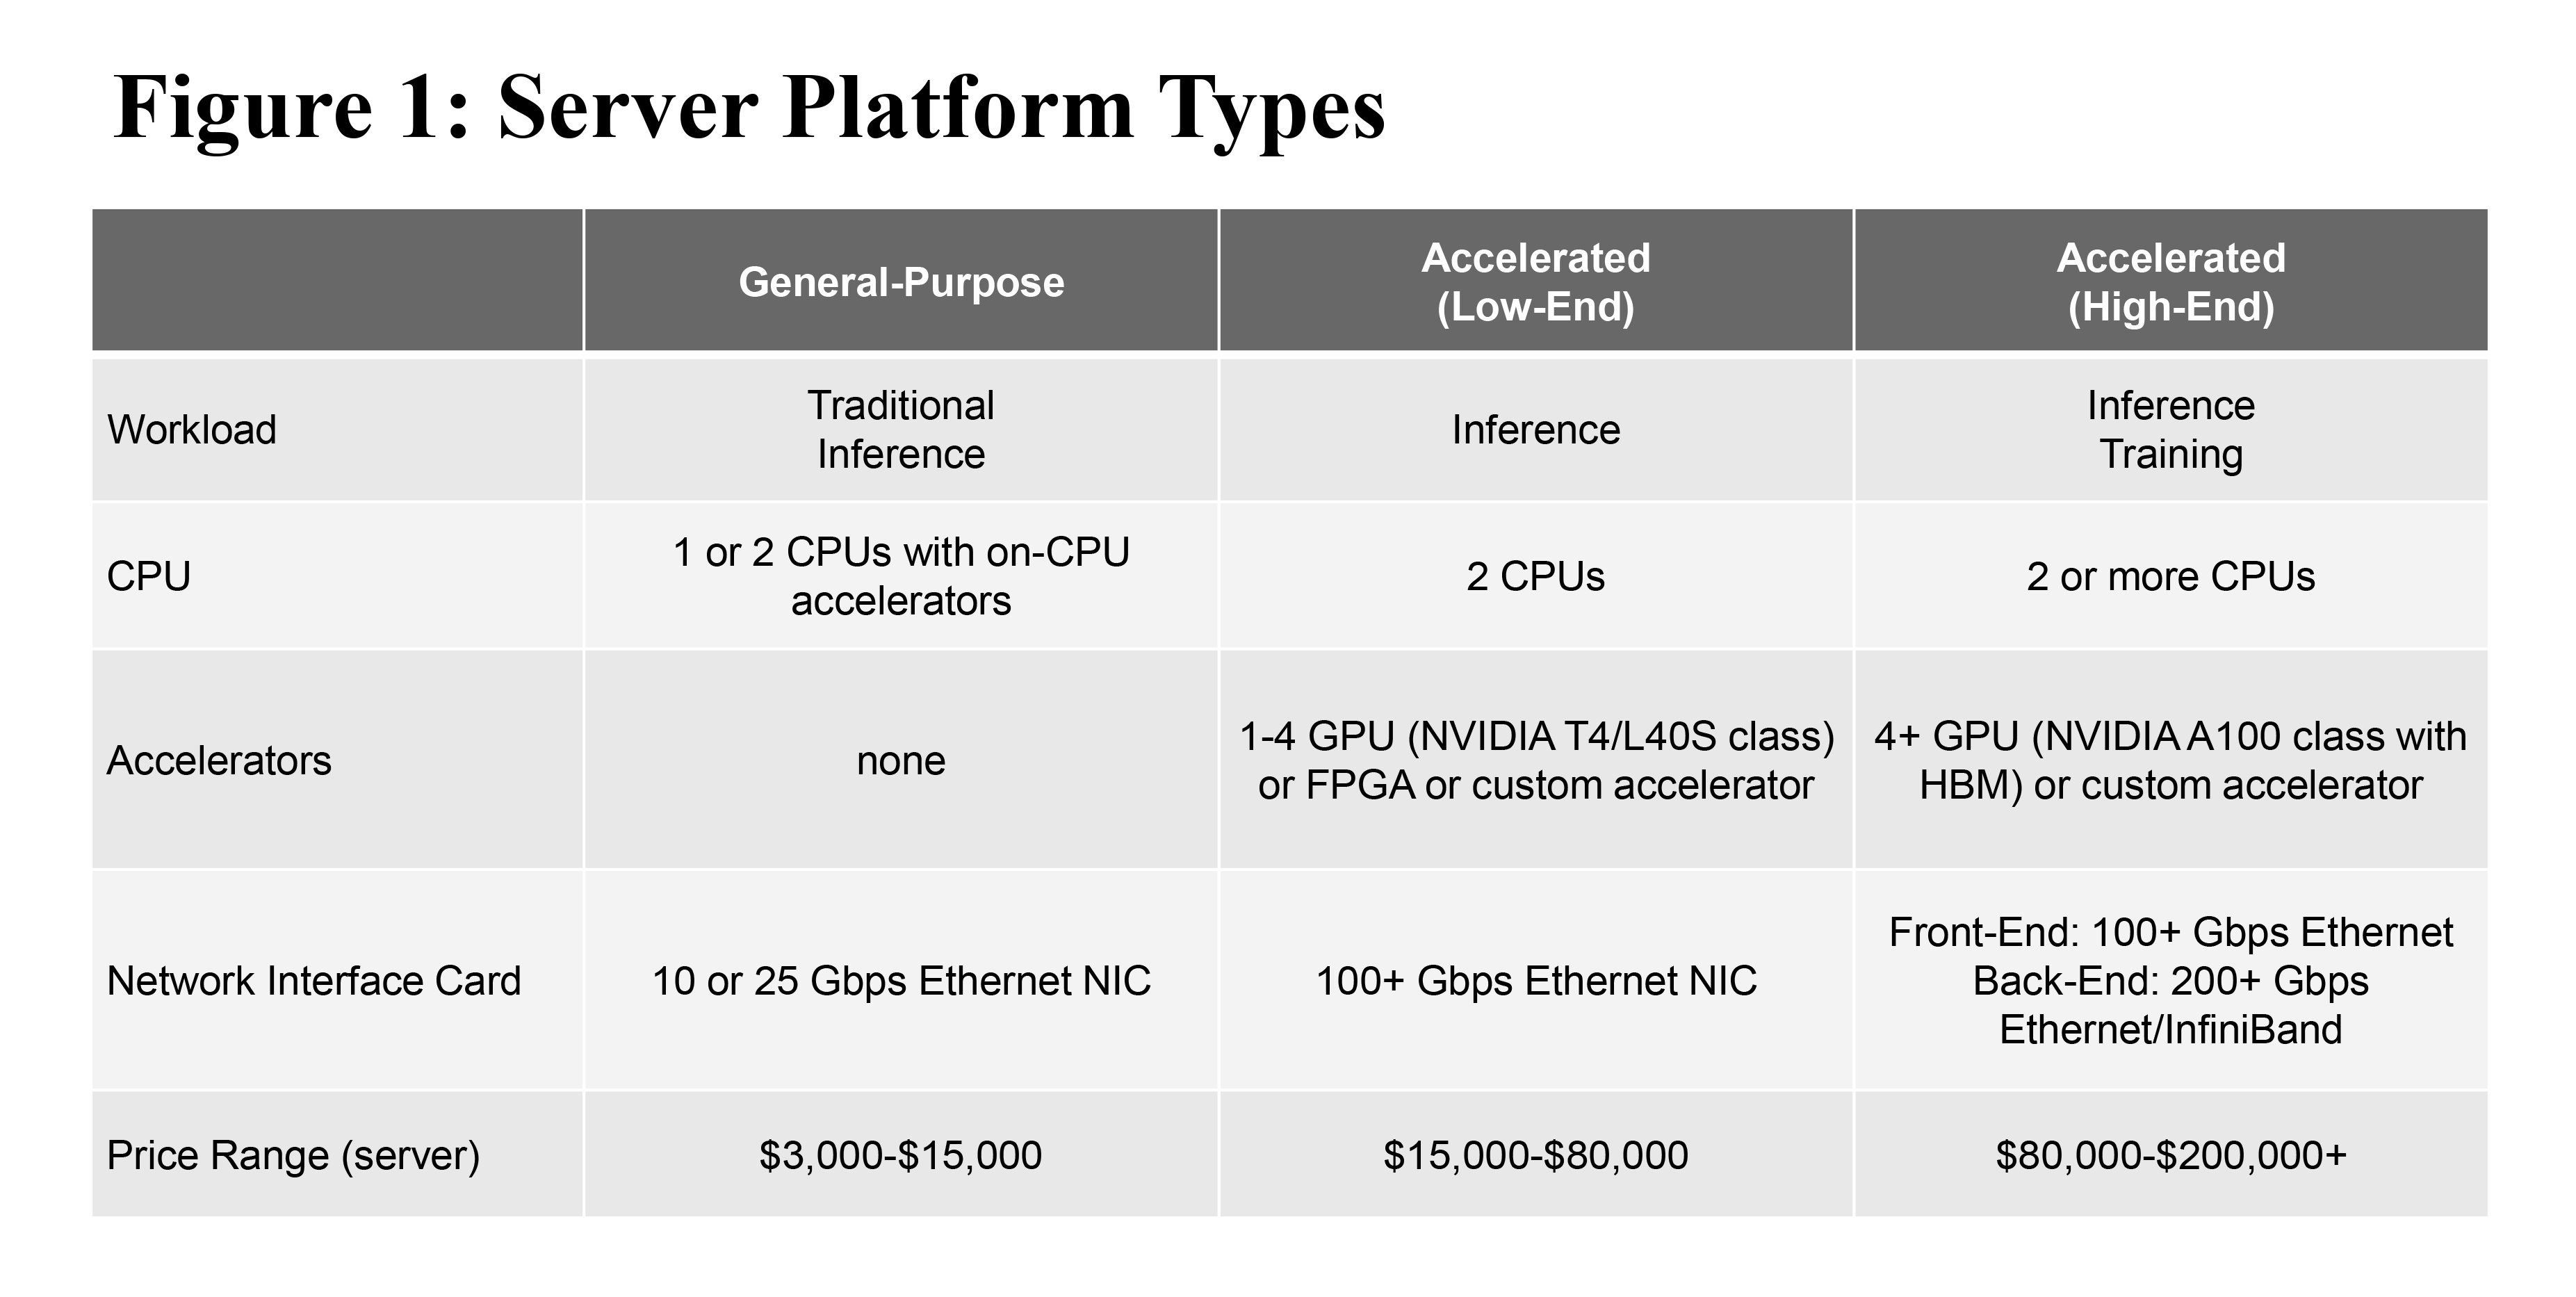
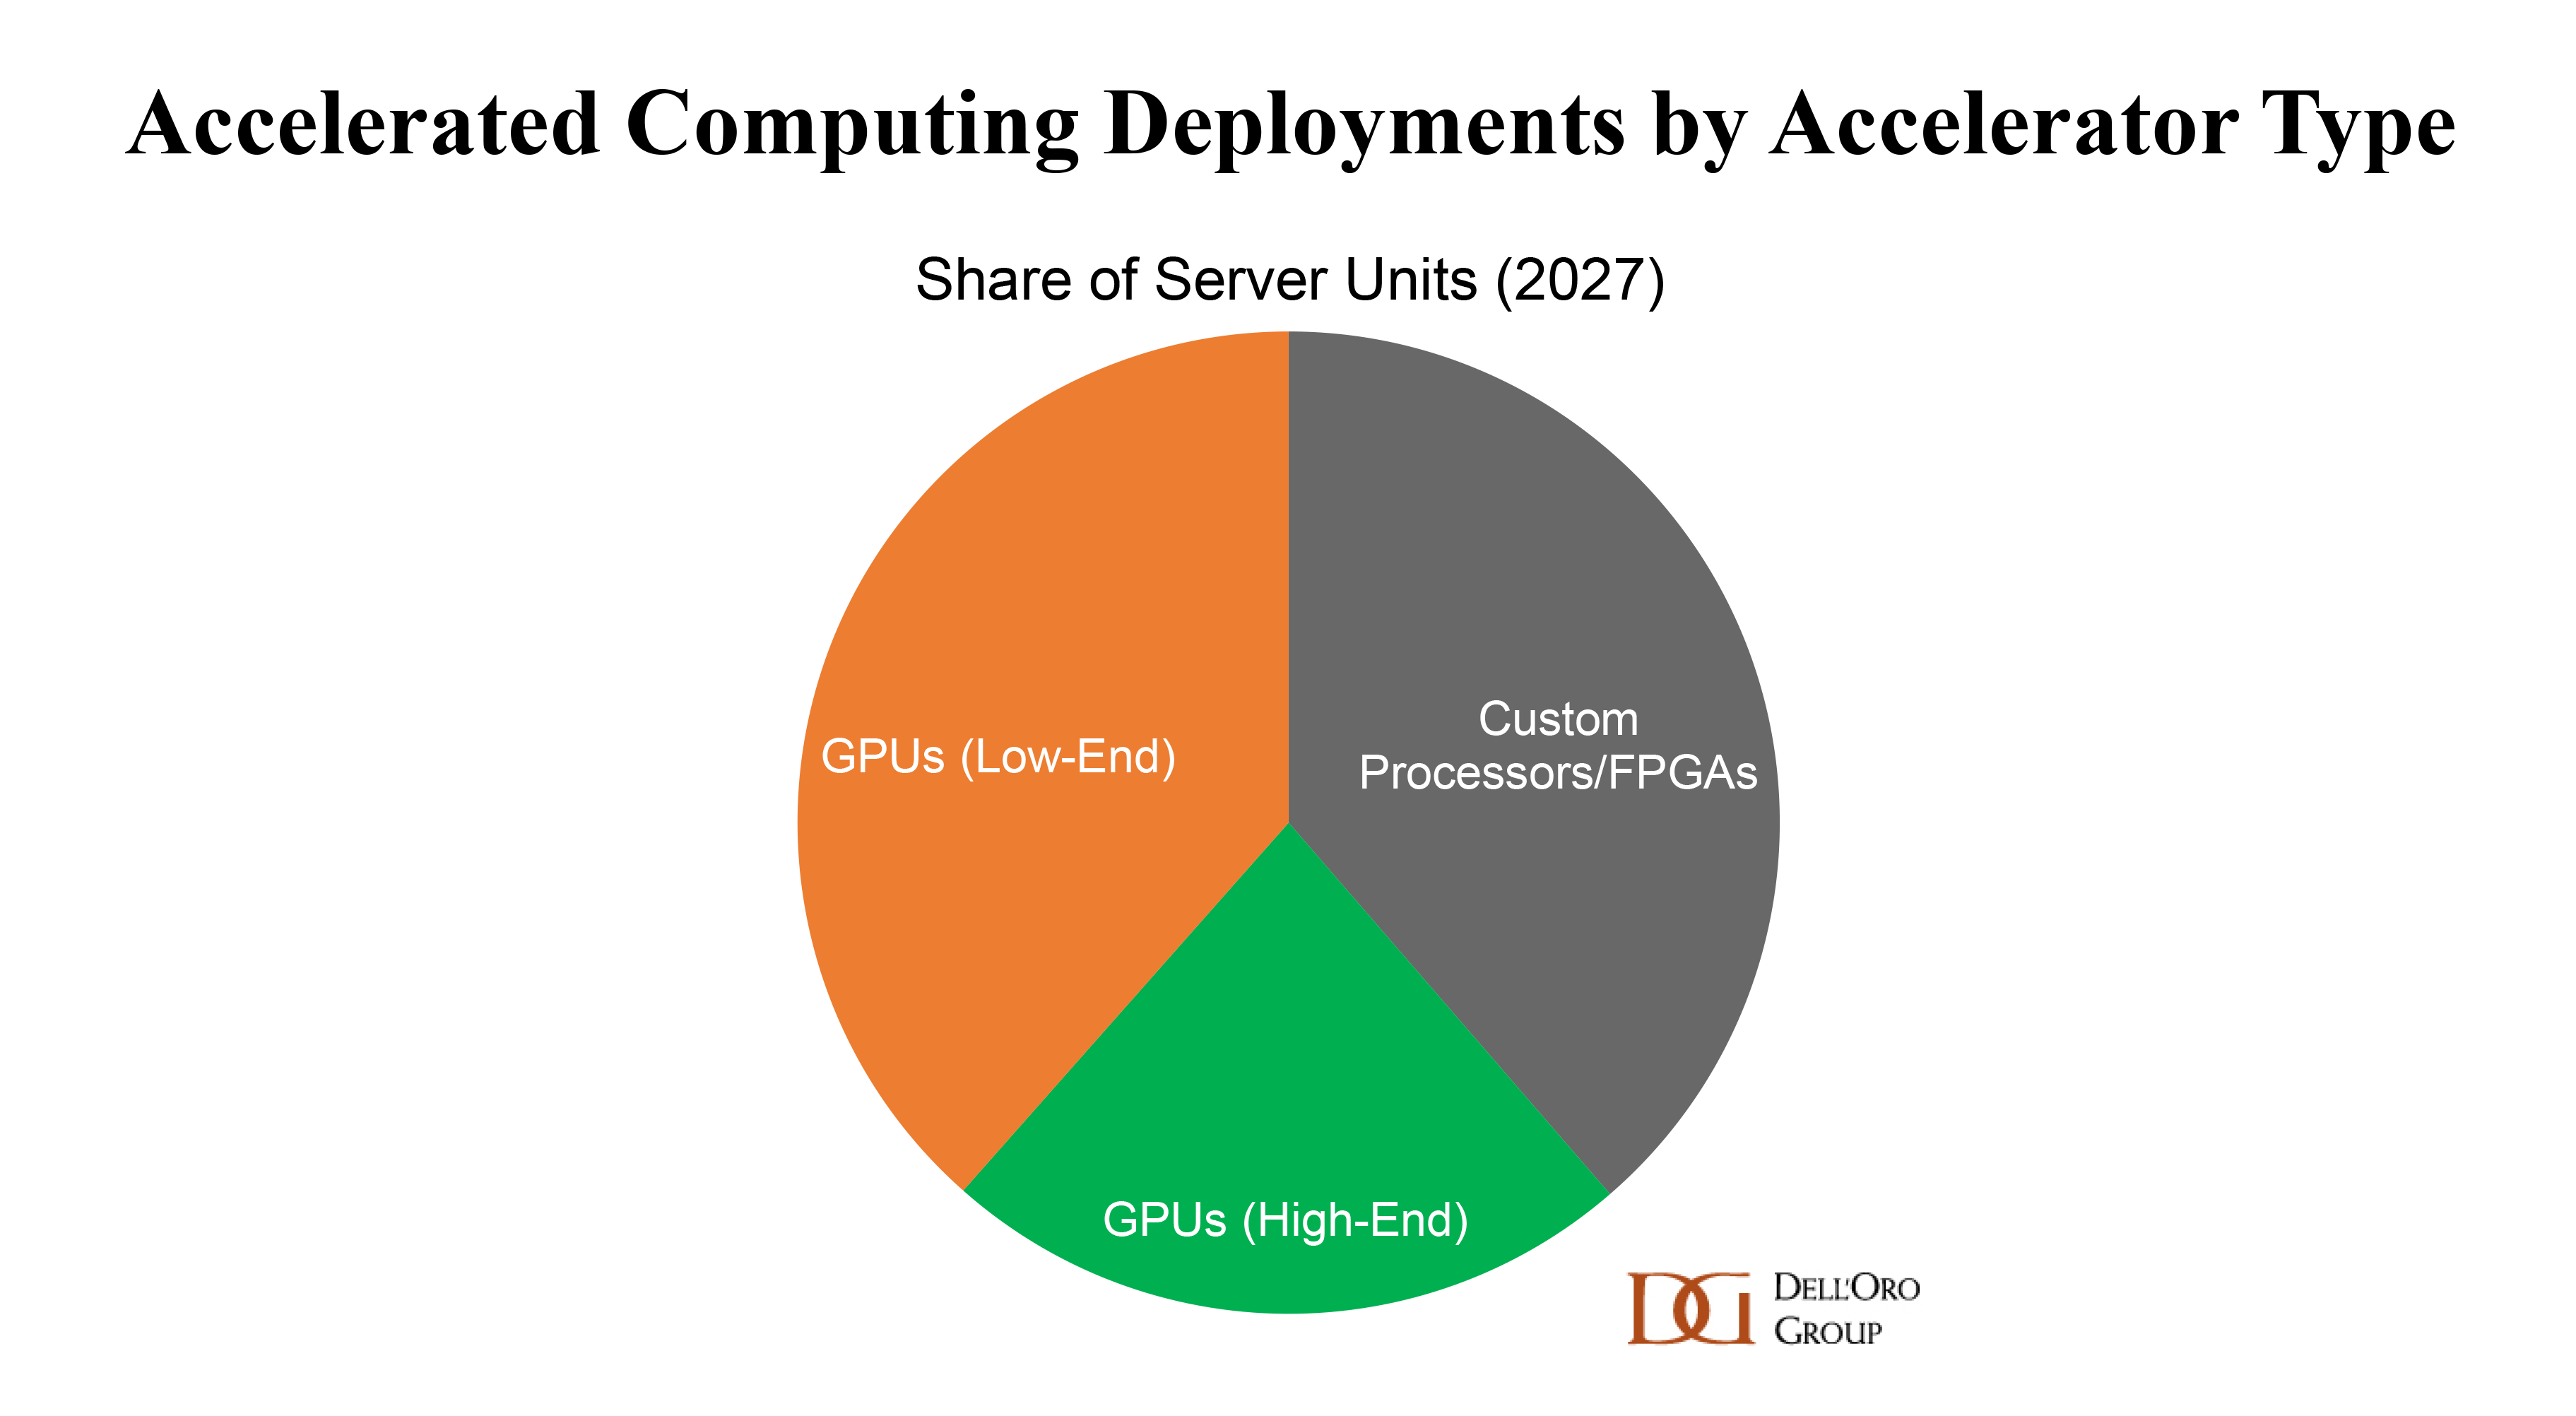
We expect each of these platform types to have a different growth expectation. Growth of general-purpose servers is slowing, with a 5-year CAGR of less than 5% given increasing CPU core counts and use of virtualization. On the other hand, accelerated systems are forecast for a 5-year CAGR in the range of approximately 40%. By 2027, we project accelerated systems will account for approximately a 16% share of all server shipments, and will have the mix of accelerator types as shown in Figure 2.
Looking ahead we expect continued innovation and new architectures to support the growth of AI. More specialized systems and processors will be developed that will enable more efficient and sustainable computing. We also expect the vendor landscape to be more diversified, with compelling solutions from the vendors and cloud service providers to optimize the performance of each workload.
To get additional insights and outlook for servers and components such as accelerators and CPUs for the data center market, please check out our Data Center Capex report and Data Center IT Semiconductor and Components report.