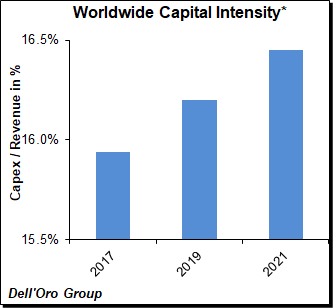
We recently published the 1H19 Telecom Capex Report. In short, we did not make any material adjustments to the overall capex forecast. With firmer readings about the market developments in the first half of the year, we remain confident that that there are reasons to be optimistic about the underlying demand drivers for both existing and new uses cases. Following three years of declining capex trends between 2015 and 2017 and flat growth in 2018, we forecast global capex to improve at a CAGR of 1% between 2018 and 2021, driven primarily by strong demand for wireless/5G related projects in the Asia Pacific region.
 Constrained operator revenue growth is expected to be one of the primary inhibitors of further telco capex acceleration. With currency-adjusted carrier revenues projected to remain relatively stable over the forecast period, strong coupling between revenue and capex growth will ensure that capital intensities remain relatively flat over time. At the same time, the pickup in capex/revenue for the 1H19 period underpinned projections that operators are comfortable with some deviation in the short-term to accommodate the rollout of 5G.
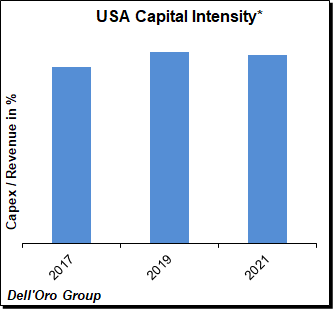
After two consecutive years of robust capex expansion in the U.S., the full year 2019 outlook remains favorable but the investment envelope beyond 2019 will likely be more subdued. The projected capex envelope for the U.S. telecom market assumes mid-band related capex will remain elevated, millimeter wave (mmW) investments will increase, and low-band driven capex will remain flat or decline.
The concept of network sharing is not new. But with operators in Europe and China announcing new passive and  active sharing arrangements, we are fielding more questions than typically for this topic, reflecting a renewed concern an uptick in partnership announcements could impact the RAN market negatively.
Our current thesis is that there will be more 5G cycles than 4G cycles and improved efficiencies through sharing agreements will ultimately enable the carriers to address most of the 5G waves without material adjustments to capex/revenue. While operators are comfortable growing the capex/revenue ratio slightly in the short-term, they are also fully aware of the demand side challenges and have no plans to return to historical capital intensity ratios.
In other words, we don’t expect any significant near-term capex cuts as a result of these engagements and instead view sharing partnerships as an opportunity for the operators to deploy broader and deeper 5G networks addressing many of the 5G opportunities with constrained budgets at a much faster pace relative to the base case of deploying 5G independently. And with non-equipment related capex and opex comprising the majority of the cell site TCO (RAN ~15%), the improved utilization will likely have the greatest impact on non-equipment related investments.
